INVITE-ONLY SCRIPT
ATR Levels by Tabby
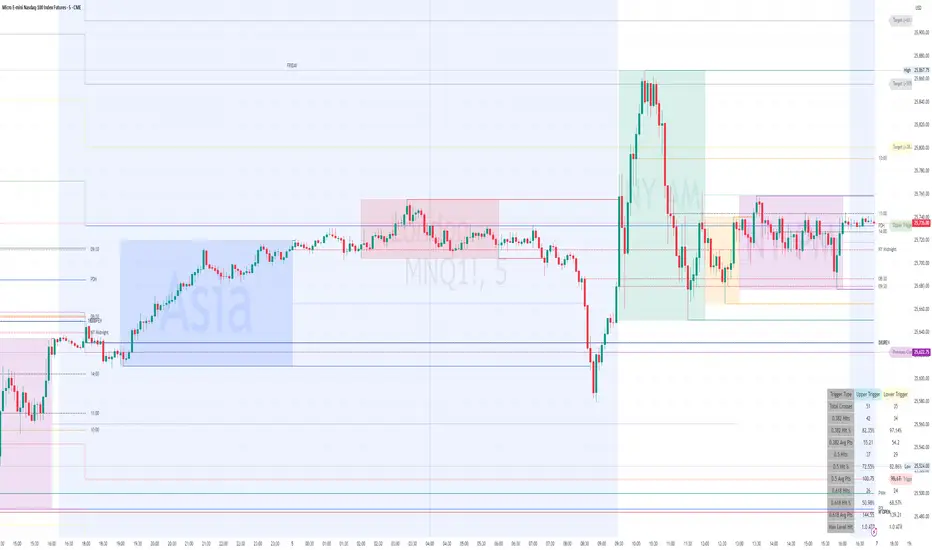
ATR levels refer to the horizontal lines plotted on a chart based on the Average True Range (ATR) indicator, which measures market volatility, not direction, by showing average price movement over time, helping traders set dynamic stops, targets (like 1x, 2x ATR), and identify potential breakouts or consolidation areas by observing if price moves are larger or smaller than the average range.
免責聲明
這些資訊和出版物並非旨在提供,也不構成TradingView提供或認可的任何形式的財務、投資、交易或其他類型的建議或推薦。請閱讀使用條款以了解更多資訊。