PROTECTED SOURCE SCRIPT
已更新 BTC Time Cycle
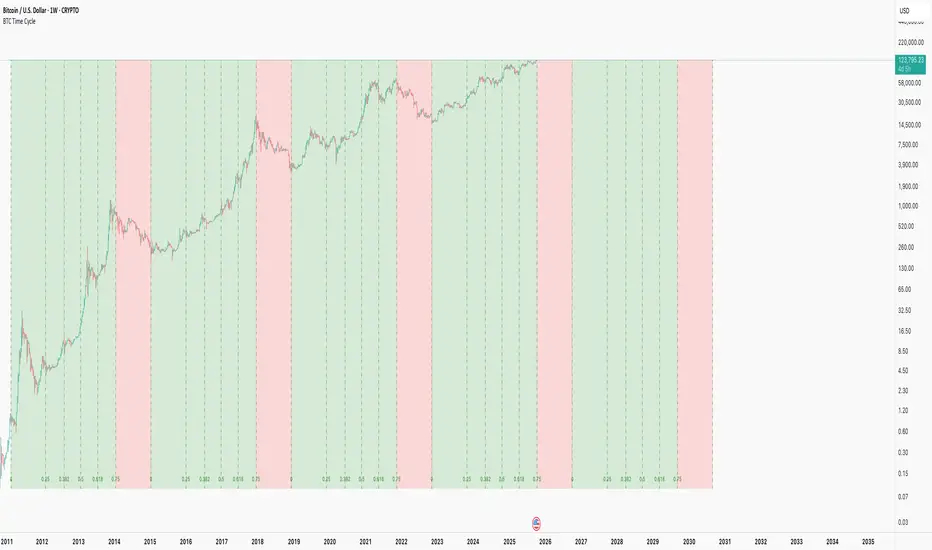
This indicator helps track Bitcoin's historical four-year cycles by dividing time from market bottoms into Fibonacci-based segments, providing clear visual cues for potential bullish and bearish phases.
How It Works: This indicator overlays repeating Fibonacci-based time cycles onto weekly BTC charts, plotting vertical lines at key Fib ratios (0, 0.25, 0.382, 0.5, 0.618, 0.75, 1.0) to track cycle progress. Each cycle concludes at 1.0 and seamlessly resets as the next cycle's 0, capturing historical trough-to-trough intervals like those observed from 2018 to 2022. The week preceding the 0.75 Fibonacci ratio typically signals the cycle peak and bear market onset, transitioning through the final phase until 1.0 initiates a new cycle.
Disclaimer: This pattern has consistently repeated in past cycles, but financial markets are inherently unpredictable—it is not guaranteed to persist and remains valid only until disproven. Treat it as an analytical aid, not a predictive certainty.
This is merely a curiosity and is: True until it isn't™
發行說明
This indicator helps track Bitcoin's historical four-year cycles by dividing time from market bottoms into Fibonacci-based segments, providing clear visual cues for potential bullish and bearish phases.How It Works: This indicator overlays repeating Fibonacci-based time cycles onto weekly BTC charts, plotting vertical lines at key Fib ratios (0, 0.25, 0.382, 0.5, 0.618, 0.75, 1.0) to track cycle progress. Each cycle concludes at 1.0 and seamlessly resets as the next cycle's 0, capturing historical trough-to-trough intervals like those observed from 2018 to 2022. The week preceding the 0.75 Fibonacci ratio typically signals the cycle peak and bear market onset, transitioning through the final phase until 1.0 initiates a new cycle.
Disclaimer: This pattern has consistently repeated in past cycles, but financial markets are inherently unpredictable—it is not guaranteed to persist and remains valid only until disproven. Treat it as an analytical aid, not a predictive certainty.
This is merely a curiosity and is: True until it isn't™
受保護腳本
此腳本以閉源形式發佈。 不過,您可以自由使用,沒有任何限制 — 點擊此處了解更多。
免責聲明
這些資訊和出版物並非旨在提供,也不構成TradingView提供或認可的任何形式的財務、投資、交易或其他類型的建議或推薦。請閱讀使用條款以了解更多資訊。
免責聲明
這些資訊和出版物並非旨在提供,也不構成TradingView提供或認可的任何形式的財務、投資、交易或其他類型的建議或推薦。請閱讀使用條款以了解更多資訊。