INVITE-ONLY SCRIPT
已更新 MCDX Pro+ | BMS
Published 10 June 2021
MCDX Pro+ | BMS
Bull Momentum System Pro
Use this indicators with other BMS indicators.
(Smart Power / MC Pro++ / SMI Pro+)
How to use:
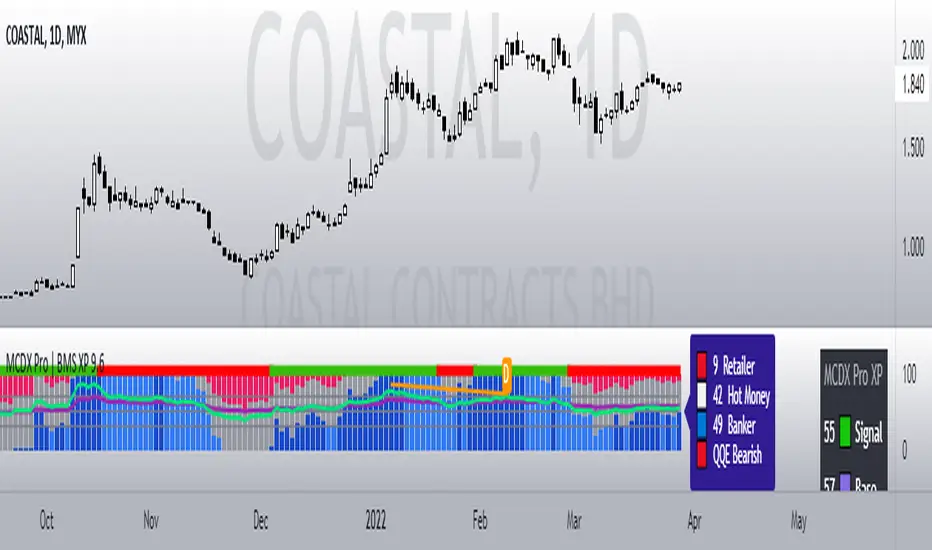
This indicator detects Banker volume.
Green Bars = Retailer ( Bearish / Downtrend)
Gray Bars = Hot Money (Sideways / FIFO)
Red Bars = Banker Smart Money ( Bullish Uptrend)
Pink Bars = Weak Banker (Pullback / Unloading / Technical Rebound)
Blue line = FIFO entry
- Blue line is a fast signal to enter when there is no banker yet.
- Good for BTST / FIFO trade.
- If Blue Line is up too strong a fast pullback may happen
- Yellow line = Bearish (pullback)
- Blue line up together with Red bars means strong bullish.
Overbought / Oversold symbol:
Orange Circle = Overbought / Possible very strong bull
Blue Circle = Oversold / Possible bottom catch / Rebound
Banker levels and Rocket symbol:
Level 0% = No Banker show 0 Rocket
Level 25% = Banker step-in show 1 Rocket
Level 50% = Banker build position show 2 Rocket
Level 75% = Banker takes control show 3 Rocket
Level 100% = Banker overbought show 4 Rocket
Best entry when position is Oversold and Red Banker step-in
and build-up position more than 50% level.
Take profit when Overbought, Pink Bars (banker unloading) and
Blue line turns Yellow line.
MCDX Pro+ | BMS
Bull Momentum System Pro
Use this indicators with other BMS indicators.
(Smart Power / MC Pro++ / SMI Pro+)
How to use:
This indicator detects Banker volume.
Green Bars = Retailer ( Bearish / Downtrend)
Gray Bars = Hot Money (Sideways / FIFO)
Red Bars = Banker Smart Money ( Bullish Uptrend)
Pink Bars = Weak Banker (Pullback / Unloading / Technical Rebound)
Blue line = FIFO entry
- Blue line is a fast signal to enter when there is no banker yet.
- Good for BTST / FIFO trade.
- If Blue Line is up too strong a fast pullback may happen
- Yellow line = Bearish (pullback)
- Blue line up together with Red bars means strong bullish.
Overbought / Oversold symbol:
Orange Circle = Overbought / Possible very strong bull
Blue Circle = Oversold / Possible bottom catch / Rebound
Banker levels and Rocket symbol:
Level 0% = No Banker show 0 Rocket
Level 25% = Banker step-in show 1 Rocket
Level 50% = Banker build position show 2 Rocket
Level 75% = Banker takes control show 3 Rocket
Level 100% = Banker overbought show 4 Rocket
Best entry when position is Oversold and Red Banker step-in
and build-up position more than 50% level.
Take profit when Overbought, Pink Bars (banker unloading) and
Blue line turns Yellow line.
發行說明
Add RSI line and algorithm.發行說明
Upgraded to version 3 now with RSI Divergence alert.發行說明
Add top horizontal RSI bull bear line.發行說明
New smart color line and divergence line.發行說明
Code optimization.發行說明
Add Stoc & RSI color icon on info panel, sensitivity algorithm and color settings.發行說明
Minor cosmetic fixed.發行說明
Updated to XP version with ID-VWAP switch mode.發行說明
New VL (Volatility Line) color RED = Pullback / BLUE = Bullish.Removed ID-VWAP switch, one mode works in different time-frames.
Smoothed Stochastic line reduced noise.
發行說明
Updated to Pine Script v5. New HMA line and %R line indicator.發行說明
Reinvented the MCDX with new color scheme. Smoothed RMA line and high accuracy QQE range filter.發行說明
Double RSI now integrates with MCDX.免責聲明
這些資訊和出版物並非旨在提供,也不構成TradingView提供或認可的任何形式的財務、投資、交易或其他類型的建議或推薦。請閱讀使用條款以了解更多資訊。