OPEN-SOURCE SCRIPT
已更新 Asset Correlation
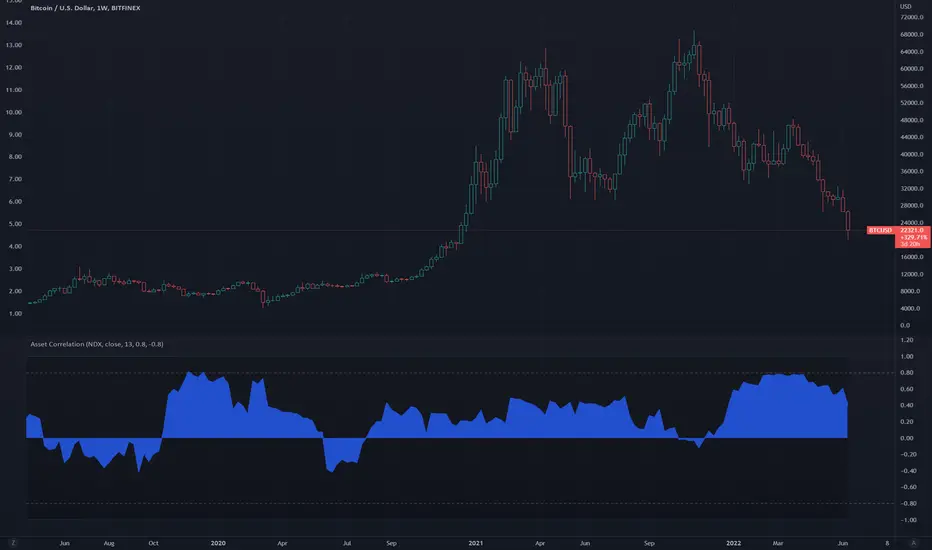
This indicator shows correlation strength between the source asset plotted in the main chart and a user-input asset in the indicator panel. For example, if the main chart panel is displaying BTCUSD and the correlation indicator is NDX, then the correlation strength is plotted as the relationship between the two. A strong positive correlation target is set at 0.80 but can be changed. A strong negative correlation target is set at -0.80 and can also be changed.
The indicator also has an option for a plot of the ta.correlation() function for a reference line.
The indicator also has an option for a plot of the ta.correlation() function for a reference line.
發行說明
Changes as follows:- Fixed scale issue y axis for reference plot of ta.correlation(), which is hidden by default. As plots can’t be called from a local scope, the transparency of the plot is set to 100 when turned off which previously affected the y axis scale. Update sets ta.correlation() plot value to 0 and transparency to 100, when bShowTradingViewCorrelation is false.
開源腳本
秉持TradingView一貫精神,這個腳本的創作者將其設為開源,以便交易者檢視並驗證其功能。向作者致敬!您可以免費使用此腳本,但請注意,重新發佈代碼需遵守我們的社群規範。
免責聲明
這些資訊和出版物並非旨在提供,也不構成TradingView提供或認可的任何形式的財務、投資、交易或其他類型的建議或推薦。請閱讀使用條款以了解更多資訊。
免責聲明
這些資訊和出版物並非旨在提供,也不構成TradingView提供或認可的任何形式的財務、投資、交易或其他類型的建議或推薦。請閱讀使用條款以了解更多資訊。