INVITE-ONLY SCRIPT
已更新 neXt FVG MTF PRO [cognyto]
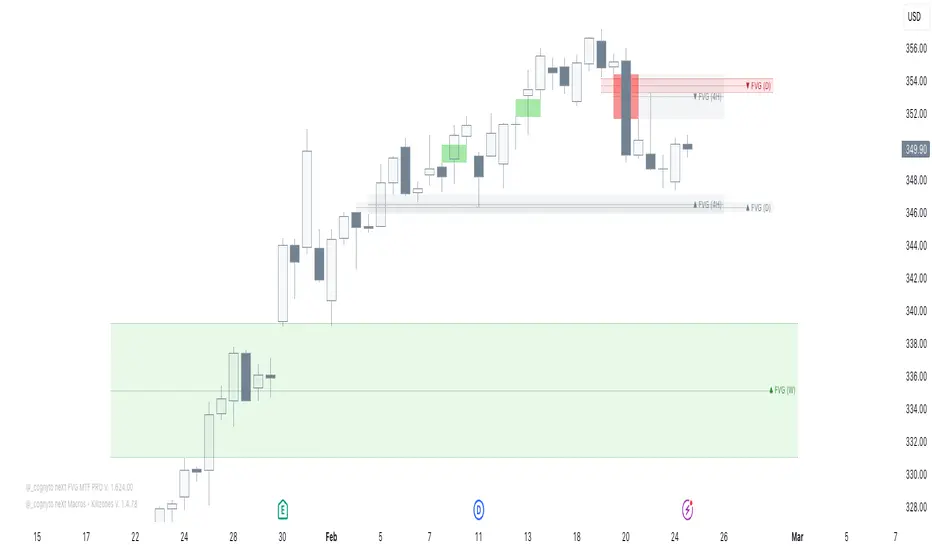
The neXt FVG Multi-Timeframe Indicator represents a remarkable edge in Fair Value Gap analysis. It offers traders a comprehensive and simplified interface to simultaneously monitor Fair Value Gaps across up to 9 different configurable timeframes. This feature shows traders exclusively the closest and most relevant gaps, enabling more precise top-down price action analysis. This makes it particularly valuable for strategies focused on market liquidity and inefficiencies.
Here are the 10 fundamental features that distinguish this indicator
1. Intelligent Visualisation of Next Gaps
An advanced filtering system is implemented to prioritise the visualisation of the nearest FVGs, hence its name -next-, offering a clean FVGs layout on the screen and improving analysis precision. The visualisation system continuously updates according to market price evolution, and as FVGs appear, are mitigated, or eliminated across different timeframes, it updates to ensure a structured and efficient interface.

2. Top-Down Multi-Timeframe Analysis
An efficient visualisation system is implemented to simultaneously manage up to 9 different timeframes. The differentiation between FVGs and their timeframes is established through proportional length in their visual presentation, where higher timeframes extend further to the right, establishing a clear visual hierarchy. The further right the gap extends, the stronger its significance. This structure allows visualization of both current timeframe gaps and those of higher timeframes, facilitating comprehensive market analysis.

3. Alerts
The indicator incorporates a complete notification system that allows users to stay informed in real-time about a wide range of critical events related to Gaps. This system includes customisable alerts for new Fair Value Gaps formation, mitigation notifications, and precise identification of significant gap breakout patterns, technically known as Breakaway gaps.
4. Mitigation
Mitigations represent a fundamental element in technical analysis, identifying zones where price has reached equilibrium. Considering the analytical importance of mitigated gaps, the indicator maintains their visualisation with a specific different color distinction. Additionally, it includes optional functionality for removing mitigated gaps, which can be activated according to user preferences.

5. BISI and SIBI
In addition to the FVGs present in all timeframes, the indicator facilitates precise configuration of BISI and SIBI gaps in the current timeframe, maintaining dynamic visualisation during the additional analysis process alongside other timeframes. This feature optimises the evaluation of historical market imbalances and inefficiencies, offering significant analytical perspectives in the current timeframe, and even refining market entry or exit strategies.

6. Breakaway-Gaps
The indicator provides advanced functionality for identifying and analysing Breakaway-Gaps, presenting in a structured manner the corresponding candle formations that create the Gap. This feature allows precise evaluation of strong market movements, including the assessment of potential retracements and directional patterns in high volatility conditions.

7. Consequent-Encroachment (C.E.)
The indicator implements advanced functionality that visualizes the midpoint of the displacement candle that generates the gap, using precise calculation based on the opening and closing levels of that candle.

8. FVG Fulfilment
The indicator offers advanced configuration options for FVG fullfilmet conditions through two main criteria: confirmation through candle closure that exceeds the established FVG limits, or validation through the intersection of extreme candle levels (maximum/minimum) with the FVG threshold.
9. FVG-Visualisations
Gaps are visualised on the platform once the third candle formation is complete. The system provides optional visualisation functionality during the formation process, although this feature is specifically recommended for predictive analysis, being most effective during daily or weekly market closing intervals. This feature maintains its consistency exclusively in the active timeframe.
10. Customisation
The indicator presents a wide range of advanced customisation options, facilitating comprehensive modification of visual elements. This includes professional adaptation of color palettes, typographic dimensions, line configurations, and design attributes, allowing precise optimisation according to specific user analytical requirements.
This indicator is available exclusively on TradingView. To access it, please see the ‘Author's Instructions’ above and visit our website.
DISCLAIMER
This indicator is provided for informational and educational purposes only. It does not constitute financial advice, trading advice, or any other type of advice, and should not be interpreted as a recommendation to buy, sell, or hold any investment or security of any kind. The information provided by this indicator is not intended as a substitute for professional financial advice. Users of this indicator bear sole responsibility for their trading and investment decisions, including the interpretation of market data and signals generated by this indicator. Past performance is not indicative of future results. Trading financial markets carries substantial risk of loss. Users should conduct their own research, seek professional advice when needed, and exercise due diligence before making any trading or investment decisions.
Here are the 10 fundamental features that distinguish this indicator
1. Intelligent Visualisation of Next Gaps
An advanced filtering system is implemented to prioritise the visualisation of the nearest FVGs, hence its name -next-, offering a clean FVGs layout on the screen and improving analysis precision. The visualisation system continuously updates according to market price evolution, and as FVGs appear, are mitigated, or eliminated across different timeframes, it updates to ensure a structured and efficient interface.
2. Top-Down Multi-Timeframe Analysis
An efficient visualisation system is implemented to simultaneously manage up to 9 different timeframes. The differentiation between FVGs and their timeframes is established through proportional length in their visual presentation, where higher timeframes extend further to the right, establishing a clear visual hierarchy. The further right the gap extends, the stronger its significance. This structure allows visualization of both current timeframe gaps and those of higher timeframes, facilitating comprehensive market analysis.
3. Alerts
The indicator incorporates a complete notification system that allows users to stay informed in real-time about a wide range of critical events related to Gaps. This system includes customisable alerts for new Fair Value Gaps formation, mitigation notifications, and precise identification of significant gap breakout patterns, technically known as Breakaway gaps.
4. Mitigation
Mitigations represent a fundamental element in technical analysis, identifying zones where price has reached equilibrium. Considering the analytical importance of mitigated gaps, the indicator maintains their visualisation with a specific different color distinction. Additionally, it includes optional functionality for removing mitigated gaps, which can be activated according to user preferences.
5. BISI and SIBI
In addition to the FVGs present in all timeframes, the indicator facilitates precise configuration of BISI and SIBI gaps in the current timeframe, maintaining dynamic visualisation during the additional analysis process alongside other timeframes. This feature optimises the evaluation of historical market imbalances and inefficiencies, offering significant analytical perspectives in the current timeframe, and even refining market entry or exit strategies.
6. Breakaway-Gaps
The indicator provides advanced functionality for identifying and analysing Breakaway-Gaps, presenting in a structured manner the corresponding candle formations that create the Gap. This feature allows precise evaluation of strong market movements, including the assessment of potential retracements and directional patterns in high volatility conditions.
7. Consequent-Encroachment (C.E.)
The indicator implements advanced functionality that visualizes the midpoint of the displacement candle that generates the gap, using precise calculation based on the opening and closing levels of that candle.
8. FVG Fulfilment
The indicator offers advanced configuration options for FVG fullfilmet conditions through two main criteria: confirmation through candle closure that exceeds the established FVG limits, or validation through the intersection of extreme candle levels (maximum/minimum) with the FVG threshold.
9. FVG-Visualisations
Gaps are visualised on the platform once the third candle formation is complete. The system provides optional visualisation functionality during the formation process, although this feature is specifically recommended for predictive analysis, being most effective during daily or weekly market closing intervals. This feature maintains its consistency exclusively in the active timeframe.
10. Customisation
The indicator presents a wide range of advanced customisation options, facilitating comprehensive modification of visual elements. This includes professional adaptation of color palettes, typographic dimensions, line configurations, and design attributes, allowing precise optimisation according to specific user analytical requirements.
This indicator is available exclusively on TradingView. To access it, please see the ‘Author's Instructions’ above and visit our website.
DISCLAIMER
This indicator is provided for informational and educational purposes only. It does not constitute financial advice, trading advice, or any other type of advice, and should not be interpreted as a recommendation to buy, sell, or hold any investment or security of any kind. The information provided by this indicator is not intended as a substitute for professional financial advice. Users of this indicator bear sole responsibility for their trading and investment decisions, including the interpretation of market data and signals generated by this indicator. Past performance is not indicative of future results. Trading financial markets carries substantial risk of loss. Users should conduct their own research, seek professional advice when needed, and exercise due diligence before making any trading or investment decisions.
發行說明
V. 1.629- Enhanced performance for smoother operation
- Optimized color settings for both light and dark display modes
發行說明
V. 1.632- [] Bug fix: Optimized memory management
[] Enhanced color adjustments for multiple screen contrast levels
發行說明
V. 1.638- Enhanced real-time mitigation for scalpers trading on second and minute timeframes
發行說明
V. 1.662- New: Tick-by-tick precision in FVG mitigation with retracement detection
發行說明
V. 1.750- Bug Fix:
-Resolved TradingView limitation that occasionally prevented drawing more than 5 FVGs in timeframes higher than the current display - Improvements:
-Removal of closed FVGs in higher timeframes now occurs instantly
-Reduced default memory retention value for previous FVGs to enhance performance
-Enhanced FVG default colors and lines for better visibility in both light and dark modes
發行說明
V. 1.794- New option to show a label when a potential ST entry exists on the 5m or 15m timeframe.
- Bug Fix: Added a condition to exclude ST alerts when the number of BISIs/SIBIs defined by the user is below 3.
僅限邀請腳本
僅作者批准的使用者才能訪問此腳本。您需要申請並獲得使用許可,通常需在付款後才能取得。更多詳情,請依照作者以下的指示操作,或直接聯絡cognyto。
TradingView不建議在未完全信任作者並了解其運作方式的情況下購買或使用腳本。您也可以在我們的社群腳本中找到免費的開源替代方案。
作者的說明
For access to this indicator, please visit our website https://trading.cogny.to and get immediate access.
Visit our website for details about how to access our indicators
trading.cogny.to
Please note that cognyto provides this content solely for informational and educational purposes. Historical performance should not be considered indicative
trading.cogny.to
Please note that cognyto provides this content solely for informational and educational purposes. Historical performance should not be considered indicative
免責聲明
這些資訊和出版物並非旨在提供,也不構成TradingView提供或認可的任何形式的財務、投資、交易或其他類型的建議或推薦。請閱讀使用條款以了解更多資訊。