INVITE-ONLY SCRIPT
已更新 SMT Supply and Demand Zones
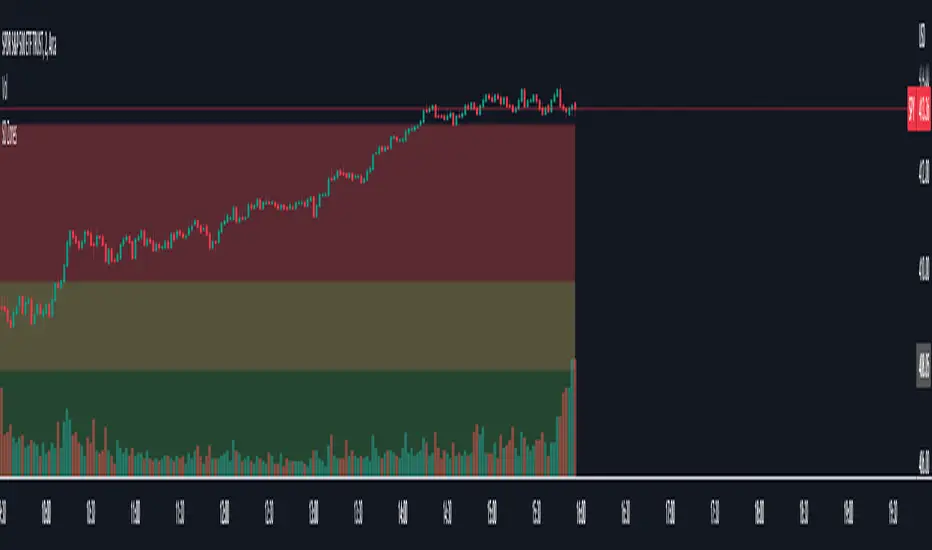
This script will automatically plot Supply and Demand Zones for the prior 10 days (20 zones total) for ANY security (stocks, indices, forex, crypto, etc.)
The features of the script include:
- Color customization for both supply and demand (default is red for supply and green for demand, but the user can choose any color combination)
- Ability to enable/disable zones for each individual day
- Labels for all zones (the day they came from and whether they are supply or demand)
- Dynamically moving levels that track price action (so that they are always in the center of your screen)
- Ability to disable labels on zones
發行說明
Zone labels changed to white text instead for candle visibility發行說明
Offset text to the left發行說明
Added the ability to define a supply and demand zone label offsetAdded the ability for the user to choose supply zone and demand zone label colors
發行說明
Script now works with free version of TradingView僅限邀請腳本
只有經作者批准的使用者才能訪問此腳本。您需要申請並獲得使用權限。該權限通常在付款後授予。如欲了解更多詳情,請依照以下作者的說明操作,或直接聯絡StockManTrading。
請注意,此私人、僅限邀請的腳本尚未經過腳本管理員審核,其是否符合社群規範尚無定論。 除非您完全信任其作者並了解腳本的工作原理,否則TradingView不建議您付費或使用腳本。您也可以在我們的社群腳本中找到免費的開源替代方案。
作者的說明
Contact StockManTrading for Access
免責聲明
這些資訊和出版物並不意味著也不構成TradingView提供或認可的金融、投資、交易或其他類型的意見或建議。請在使用條款閱讀更多資訊。
僅限邀請腳本
只有經作者批准的使用者才能訪問此腳本。您需要申請並獲得使用權限。該權限通常在付款後授予。如欲了解更多詳情,請依照以下作者的說明操作,或直接聯絡StockManTrading。
請注意,此私人、僅限邀請的腳本尚未經過腳本管理員審核,其是否符合社群規範尚無定論。 除非您完全信任其作者並了解腳本的工作原理,否則TradingView不建議您付費或使用腳本。您也可以在我們的社群腳本中找到免費的開源替代方案。
作者的說明
Contact StockManTrading for Access
免責聲明
這些資訊和出版物並不意味著也不構成TradingView提供或認可的金融、投資、交易或其他類型的意見或建議。請在使用條款閱讀更多資訊。