PROTECTED SOURCE SCRIPT
Sholi Auto Levels
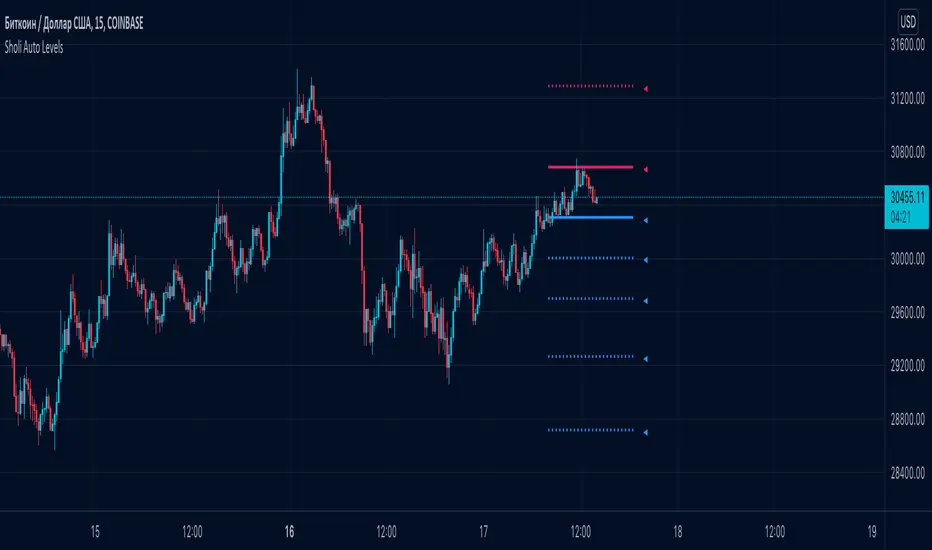
◾️ Auto levels are calculated for each timeframe separately. The script builds fibonacci levels once in a certain period for each of the timeframes. With the help of previously found support and resistance levels, high and low values, the indicator determines the most accurate distribution of fibonacci levels.
Extremely convenient for use in Technical Analysis. You can define rise or fall correction levels by the specified levels.
◾️ How to use?
Blue levels - support. Red - resistance. If you hover over the pointer near the level, you can see detailed information.
As a rule, the price moves at the indicated levels. It lingers on them and tries to break through or find support.
◾️ What is useful for you?
You will be able to build your own analytics based on clear levels that ideally determine the potential for movement in the market.
受保護腳本
此腳本以閉源形式發佈。 不過,您可以自由使用,沒有任何限制 — 點擊此處了解更多。
◼️◼️◼️◼️◼️◼️◼️◼️◼️◼️◼️◼️◼️◼️
Founder of Real Charts: linktr.ee/sholi_from_real_charts
Founder of Real Charts: linktr.ee/sholi_from_real_charts
免責聲明
這些資訊和出版物並非旨在提供,也不構成TradingView提供或認可的任何形式的財務、投資、交易或其他類型的建議或推薦。請閱讀使用條款以了解更多資訊。
受保護腳本
此腳本以閉源形式發佈。 不過,您可以自由使用,沒有任何限制 — 點擊此處了解更多。
◼️◼️◼️◼️◼️◼️◼️◼️◼️◼️◼️◼️◼️◼️
Founder of Real Charts: linktr.ee/sholi_from_real_charts
Founder of Real Charts: linktr.ee/sholi_from_real_charts
免責聲明
這些資訊和出版物並非旨在提供,也不構成TradingView提供或認可的任何形式的財務、投資、交易或其他類型的建議或推薦。請閱讀使用條款以了解更多資訊。