OPEN-SOURCE SCRIPT
MACD Support and Resistance [ChartPrime]

⯁ OVERVIEW
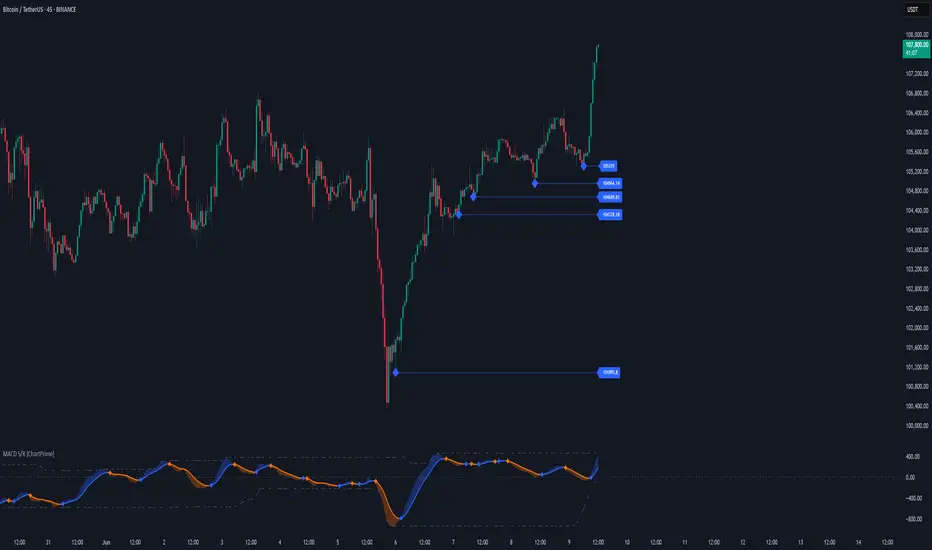
MACD Support and Resistance [ChartPrime] is a dynamic support/resistance mapping tool powered by MACD crossover logic. Each time the MACD line crosses the signal line, the indicator scans for recent price extremes and locks them in as potential support or resistance zones. These levels are automatically cleaned up if price breaks them, keeping the chart focused on active market structure. The system includes a built-in MACD display with visual markers, along with contextual highs and lows to help define the current environment.
⯁ MACD-BASED SUPPORT/RESISTANCE GENERATION
The core logic uses the MACD oscillator crossover as a trigger event to generate structural levels:
These dynamic levels reflect where price recently reversed or paused, making them prime zones for reaction, continuation, or invalidation.
⯁ LEVEL MANAGEMENT AND VALIDATION
To keep the chart clean and relevant:
This ensures that only currently respected levels remain on the chart — a major advantage for active traders.

⯁ MACD VISUALIZATION + SIGNAL MARKERS
A full MACD system is rendered on the lower panel for visual confirmation:
These visuals make it easy to understand the timing of the support/resistance updates.
⯁ LOCAL EXTREME REFERENCE LINES
To help contextualize current price position relative to recent market extremes:
They assist traders in identifying overextended or compressed MACD behavior.
⯁ USAGE
⯁ CONCLUSION
MACD Support and Resistance [ChartPrime] takes a classic momentum indicator and adds real-time structural awareness. By linking MACD crossover events to recent price extremes, it identifies the zones where market sentiment shifted — and continues to monitor their strength. Whether you're a breakout trader or looking to fade key reaction points, this tool delivers clean, actionable levels based on momentum and structure — not guesswork.
MACD Support and Resistance [ChartPrime] is a dynamic support/resistance mapping tool powered by MACD crossover logic. Each time the MACD line crosses the signal line, the indicator scans for recent price extremes and locks them in as potential support or resistance zones. These levels are automatically cleaned up if price breaks them, keeping the chart focused on active market structure. The system includes a built-in MACD display with visual markers, along with contextual highs and lows to help define the current environment.
⯁ MACD-BASED SUPPORT/RESISTANCE GENERATION
The core logic uses the MACD oscillator crossover as a trigger event to generate structural levels:
- When MACD crosses above its signal line:
→ The script scans the last 5 bars for the lowest low.
→ A support level is plotted at that price. - When MACD crosses below its signal line:
→ The script scans the last 5 bars for the highest high.
→ A resistance level is plotted at that price.
These dynamic levels reflect where price recently reversed or paused, making them prime zones for reaction, continuation, or invalidation.
⯁ LEVEL MANAGEMENT AND VALIDATION
To keep the chart clean and relevant:
- A maximum of 20 active levels are allowed at once.
- Older levels are automatically removed if the list exceeds the limit.
- If price closes below a support level or above a resistance level, the corresponding line is deleted.
This ensures that only currently respected levels remain on the chart — a major advantage for active traders.
⯁ MACD VISUALIZATION + SIGNAL MARKERS
A full MACD system is rendered on the lower panel for visual confirmation:
- The MACD line and Signal line are both plotted and color-coded dynamically.
- A filled area] highlights the spread between them to emphasize momentum strength.
*A diamond marker is drawn each time MACD crosses its signal line, alerting traders to potential trend shifts.
These visuals make it easy to understand the timing of the support/resistance updates.
⯁ LOCAL EXTREME REFERENCE LINES
To help contextualize current price position relative to recent market extremes:
- A Local High line is plotted based on the highest MACD value over the past 100 bars].
*A Local Low line is plotted based on the lowest MACD value over the past 100 bars].
*These levels are rendered lightly and serve as dynamic range boundaries.
They assist traders in identifying overextended or compressed MACD behavior.
⯁ USAGE
- Use the generated S/R levels as breakout or reversal zones.
- Watch for MACD diamond markers to confirm the timing of new levels.
- Combine these reactive zones with other ChartPrime confluence tools for higher-confidence entries.
- Use the Local High/Low zones as a volatility envelope to guide risk and trend continuation potential.
⯁ CONCLUSION
MACD Support and Resistance [ChartPrime] takes a classic momentum indicator and adds real-time structural awareness. By linking MACD crossover events to recent price extremes, it identifies the zones where market sentiment shifted — and continues to monitor their strength. Whether you're a breakout trader or looking to fade key reaction points, this tool delivers clean, actionable levels based on momentum and structure — not guesswork.
開源腳本
秉持TradingView一貫精神,這個腳本的創作者將其設為開源,以便交易者檢視並驗證其功能。向作者致敬!您可以免費使用此腳本,但請注意,重新發佈代碼需遵守我們的社群規範。
免責聲明
這些資訊和出版物並非旨在提供,也不構成TradingView提供或認可的任何形式的財務、投資、交易或其他類型的建議或推薦。請閱讀使用條款以了解更多資訊。
開源腳本
秉持TradingView一貫精神,這個腳本的創作者將其設為開源,以便交易者檢視並驗證其功能。向作者致敬!您可以免費使用此腳本,但請注意,重新發佈代碼需遵守我們的社群規範。
免責聲明
這些資訊和出版物並非旨在提供,也不構成TradingView提供或認可的任何形式的財務、投資、交易或其他類型的建議或推薦。請閱讀使用條款以了解更多資訊。