INVITE-ONLY SCRIPT
LinReg Triangular Fiffy
LinReg Triangular Fiffy
What this Script can help you with ?
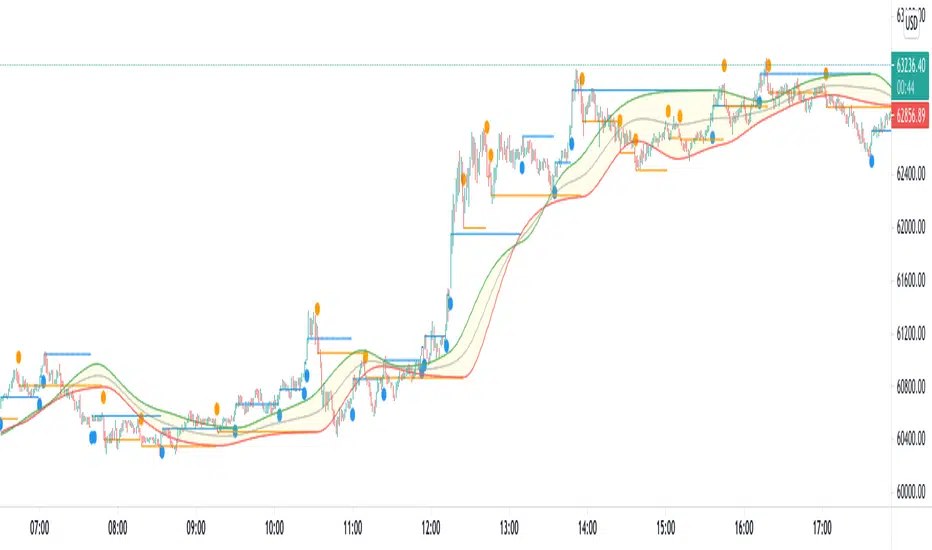
1. It helps you figure out the Historical Breaks of the Linear Regression Channel { default length : 20, stdev : 2}, These historical breaks are plotted as Blue and Orange Dots
2. Also it plots the Level corresponding the Points where the historical breaks have happened as {blue and orange horizontal Lines}
3. It takes the historical Breaks of the LR Channel as Input to a triangular function which plots the trend based market bands in yellow
** The script have Provisions for Alerts
**** LinReg Breakout Bull
**** LinReg Breakdown Bear
How to Trade with the Script ?
First you will receive the alerts that there is a break of the linReg Band [wither bullish and bearish]
Then you look at the Triangula Yellow Bands, whether it is below the closing price or above it
If you receive a Bullish Signal and the Triangular Bands are below the closing price then you take long,
If you receive a Bearish Signal and the Triangular Bands are above the closing price then you take short,
If you receive a Bearish Signal and the Triangular Bands are below the closing price then you take short, till the upper band, {for begginers, its noTrade situation}
If you receive a Bullish Signal and the Triangular Bands are above the closing price then you take Long, till the Lower band, {for begginers, its noTrade situation}
How to get access ?
Just private message me, I will be happy to share u guys!
What this Script can help you with ?
1. It helps you figure out the Historical Breaks of the Linear Regression Channel { default length : 20, stdev : 2}, These historical breaks are plotted as Blue and Orange Dots
2. Also it plots the Level corresponding the Points where the historical breaks have happened as {blue and orange horizontal Lines}
3. It takes the historical Breaks of the LR Channel as Input to a triangular function which plots the trend based market bands in yellow
** The script have Provisions for Alerts
**** LinReg Breakout Bull
**** LinReg Breakdown Bear
How to Trade with the Script ?
First you will receive the alerts that there is a break of the linReg Band [wither bullish and bearish]
Then you look at the Triangula Yellow Bands, whether it is below the closing price or above it
If you receive a Bullish Signal and the Triangular Bands are below the closing price then you take long,
If you receive a Bearish Signal and the Triangular Bands are above the closing price then you take short,
If you receive a Bearish Signal and the Triangular Bands are below the closing price then you take short, till the upper band, {for begginers, its noTrade situation}
If you receive a Bullish Signal and the Triangular Bands are above the closing price then you take Long, till the Lower band, {for begginers, its noTrade situation}
How to get access ?
Just private message me, I will be happy to share u guys!
僅限邀請腳本
只有經作者授權的使用者才能訪問此腳本,且通常需付費。您可以將此腳本加入收藏,但需先向作者申請並獲得許可後才能使用 — 點擊此處了解更多。如需更多詳情,請依照作者說明或直接聯繫Ankit_1618。
除非您完全信任其作者並了解腳本的工作原理,否則TradingView不建議您付費或使用腳本。您也可以在我們的社群腳本中找到免費的開源替代方案。
作者的說明
Just private message me, I will be happy to share u guys!
提醒:在請求訪問權限之前,請閱讀僅限邀請腳本指南。
Get Ocs Ai Trader, Your personal Ai Trade Assistant here
→ ocstrader.com
About me
AlgoTrading Certification, ( University of Oxford, Säid Business School )
PGP Research Analysis, ( NISM, SEBI )
Electronics Engineer
→ ocstrader.com
About me
AlgoTrading Certification, ( University of Oxford, Säid Business School )
PGP Research Analysis, ( NISM, SEBI )
Electronics Engineer
免責聲明
這些資訊和出版物並不意味著也不構成TradingView提供或認可的金融、投資、交易或其他類型的意見或建議。請在使用條款閱讀更多資訊。