OPEN-SOURCE SCRIPT
Oil ETF Volume
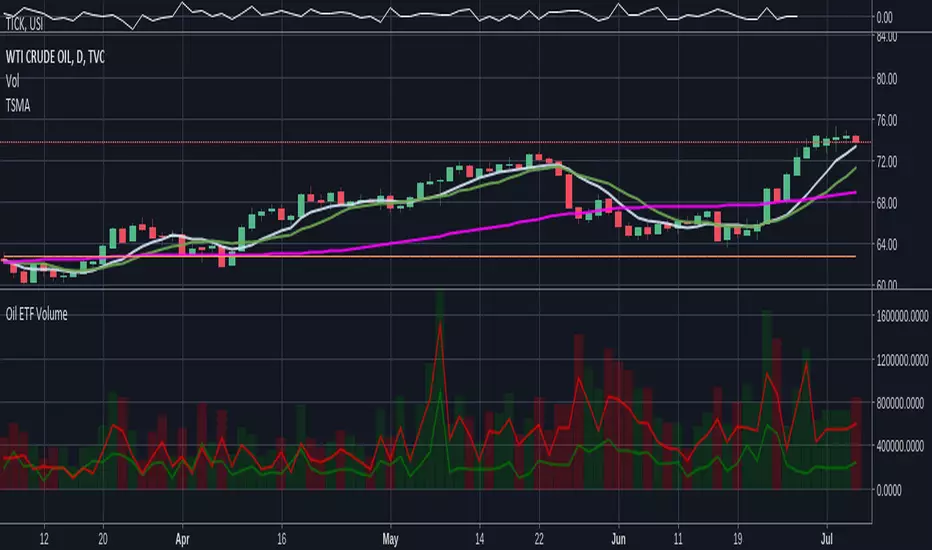
Direxxion Daily has both 'bear' and 'bull' oil ETFs. This tracks the volume in both combined. It also tracks them individually: the bear ETF is the red line, and bull the green.
NOTE: the color of the volume bars is determined by whatever ticker you're currently looking at, and whether current close is gt/lt previous close. It is intended to be used while looking at the USOIL chart. The colors will be inverted if you're looking at the 'bear' ETF! as the higher closes will actually mean price is going down :D
NOTE: the color of the volume bars is determined by whatever ticker you're currently looking at, and whether current close is gt/lt previous close. It is intended to be used while looking at the USOIL chart. The colors will be inverted if you're looking at the 'bear' ETF! as the higher closes will actually mean price is going down :D
開源腳本
秉持TradingView一貫精神,這個腳本的創作者將其設為開源,以便交易者檢視並驗證其功能。向作者致敬!您可以免費使用此腳本,但請注意,重新發佈代碼需遵守我們的社群規範。
免責聲明
這些資訊和出版物並非旨在提供,也不構成TradingView提供或認可的任何形式的財務、投資、交易或其他類型的建議或推薦。請閱讀使用條款以了解更多資訊。
免責聲明
這些資訊和出版物並非旨在提供,也不構成TradingView提供或認可的任何形式的財務、投資、交易或其他類型的建議或推薦。請閱讀使用條款以了解更多資訊。