OPEN-SOURCE SCRIPT
Trailing Sharpe Ratio
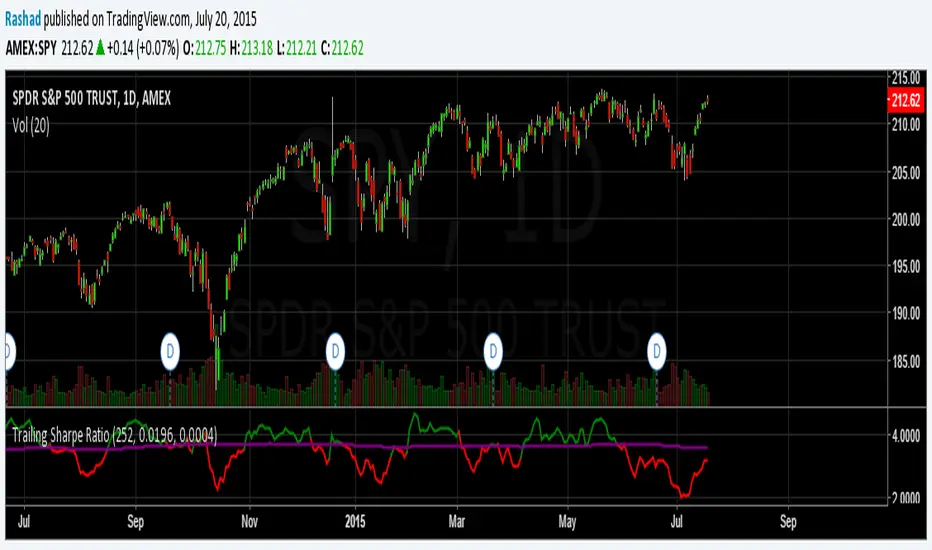
The Sharpe ratio allows you to see whether or not an investment has historically provided a return appropriate to its risk level. A Sharpe ratio above one is acceptable, above 2 is good, and above 3 is excellent. A Sharpe ratio less than one would indicate that an investment has not returned a high enough return to justify the risk of holding it. Interesting in this example, SPY's one year avg Sharpe ratio is above 3. This would mean on average SPY returns 3x better returns than the risk associated with holding it, implying there is some sort of underlying value to the investment.
When the sharpe ratio is above its signal, this implies the investment is currently outperforming compared to its typical return, below the signal means the investment is currently under performing. A negative Shape would mean that the investment has not provided a positive return, and may be a possible short candidate.
When the sharpe ratio is above its signal, this implies the investment is currently outperforming compared to its typical return, below the signal means the investment is currently under performing. A negative Shape would mean that the investment has not provided a positive return, and may be a possible short candidate.
開源腳本
本著TradingView的真正精神,此腳本的創建者將其開源,以便交易者可以查看和驗證其功能。向作者致敬!雖然您可以免費使用它,但請記住,重新發佈程式碼必須遵守我們的網站規則。
免責聲明
這些資訊和出版物並不意味著也不構成TradingView提供或認可的金融、投資、交易或其他類型的意見或建議。請在使用條款閱讀更多資訊。
免責聲明
這些資訊和出版物並不意味著也不構成TradingView提供或認可的金融、投資、交易或其他類型的意見或建議。請在使用條款閱讀更多資訊。