INVITE-ONLY SCRIPT
Ichimoku Trader Toolkit
The Ichimoku Cloud
is a collection of technical indicators that show support and resistance levels, as well as momentum and trend direction. It does this by taking multiple averages and plotting them on the chart. It also uses these figures to compute a "cloud" which attempts to forecast where the price may find support or resistance in the future. The Ichimoku cloud was developed by Goichi Hosoda, a Japanese journalist, and published in the late 1960s.
It provides more data points than the standard candlestick chart. While it seems complicated at first glance, those familiar with how to read the charts often find it easy to understand with well-defined trading signals.
The Ichimoku Cloud is useful for day traders and others who need to make quick decisions. The cloud is often paired with other technical indicators, such as the Relative Strength Index , in order for traders to get a complete picture of resistance and support. Many traders will also look out for crossovers in order to determine when trends have reversed.
Ichimoku cloud trading requires a lot of self-discipline. This is because you have to wait for the best trade signals.
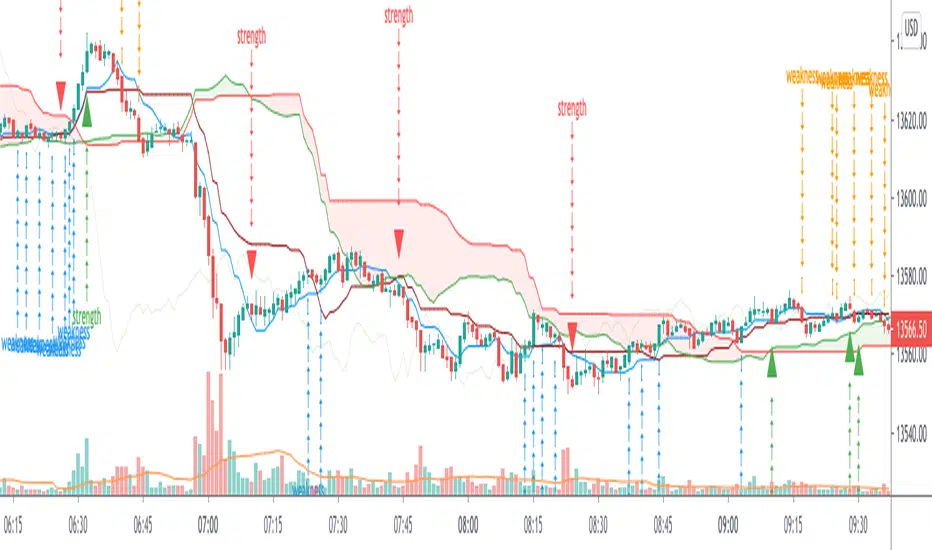
What is this Ichimoku Trader Toolkit ?
Since Ichimoku is a reliable Indicator, but its very populated on charts, Its bit complicated to find the Sign of Strength {SOS} and Sign of Weaknesses {SOW} at first glance,
The Toolkit is an attempt to make Ichimoku much more Intutive to trade and visualize the potential SOS and SOW early in the charts
What timeframes can it be used?
Any Timeframe
Provision for Alerts
Strength_alerts
Weakness_alerts
All_Alerts
How can you get access?
Private message me only, use comment box for constructive comments
is a collection of technical indicators that show support and resistance levels, as well as momentum and trend direction. It does this by taking multiple averages and plotting them on the chart. It also uses these figures to compute a "cloud" which attempts to forecast where the price may find support or resistance in the future. The Ichimoku cloud was developed by Goichi Hosoda, a Japanese journalist, and published in the late 1960s.
It provides more data points than the standard candlestick chart. While it seems complicated at first glance, those familiar with how to read the charts often find it easy to understand with well-defined trading signals.
The Ichimoku Cloud is useful for day traders and others who need to make quick decisions. The cloud is often paired with other technical indicators, such as the Relative Strength Index , in order for traders to get a complete picture of resistance and support. Many traders will also look out for crossovers in order to determine when trends have reversed.
Ichimoku cloud trading requires a lot of self-discipline. This is because you have to wait for the best trade signals.
What is this Ichimoku Trader Toolkit ?
Since Ichimoku is a reliable Indicator, but its very populated on charts, Its bit complicated to find the Sign of Strength {SOS} and Sign of Weaknesses {SOW} at first glance,
The Toolkit is an attempt to make Ichimoku much more Intutive to trade and visualize the potential SOS and SOW early in the charts
What timeframes can it be used?
Any Timeframe
Provision for Alerts
Strength_alerts
Weakness_alerts
All_Alerts
How can you get access?
Private message me only, use comment box for constructive comments
僅限邀請腳本
僅作者批准的使用者才能訪問此腳本。您需要申請並獲得使用許可,通常需在付款後才能取得。更多詳情,請依照作者以下的指示操作,或直接聯絡Ankit_1618。
TradingView不建議在未完全信任作者並了解其運作方式的情況下購買或使用腳本。您也可以在我們的社群腳本中找到免費的開源替代方案。
作者的說明
Private message me only, use comment box for constructive comments
Get Ocs Ai Trader, Your personal Ai Trade Assistant here
→ ocstrader.com
About me
AlgoTrading Certification, ( University of Oxford, Säid Business School )
PGP Research Analysis, ( NISM, SEBI )
Electronics Engineer
→ ocstrader.com
About me
AlgoTrading Certification, ( University of Oxford, Säid Business School )
PGP Research Analysis, ( NISM, SEBI )
Electronics Engineer
免責聲明
這些資訊和出版物並非旨在提供,也不構成TradingView提供或認可的任何形式的財務、投資、交易或其他類型的建議或推薦。請閱讀使用條款以了解更多資訊。