INVITE-ONLY SCRIPT
已更新 Elliott Wave - Stocks
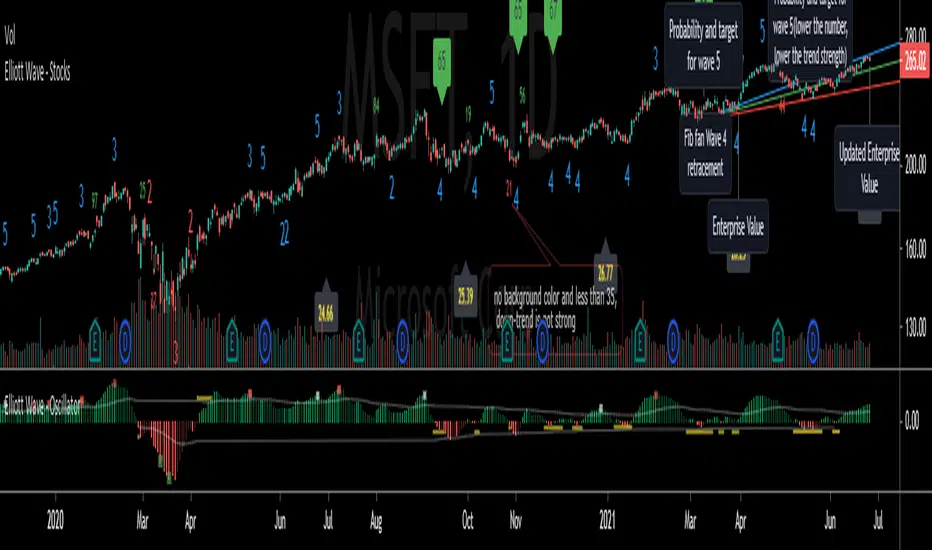
Elliott Wave, indicating possible waves 2, 3, 4 and 5
Based on my Elliott Wave - Oscillator, this signals are converted into numbers displayed on chart:
Waves2, Waves3, Waves4, Waves5:
- Indicated on Chart with numbers
Fib fan Wave 4 retracement
- Blue, green and red lines for optimum retracement
Probability and target for wave 5
- Plotted when wave 4 is found
- Stays visible in chart
- Target is based on Monthly Fibonnacci
- Probability: If current trend volume is bigger than previous opposite wave trend volume, probability is painted with color of trend background(for a trend to continue, value is recommended bigger than 35)
Projection Wave 4 (if wave 3 detected) and Projection Wave 5(if wave 4 detected)
- Only displayed when waves are active, else not displayed and not saved on chart
- For upside trend 2 blue target lines are displayed based on Monthly Fibonnacci
- For downside trend 2 red target lines are displayed based on Monthly Fibonnacci
Fundamentals: Enterprise Value
- Displayed when financial reports are updated to database
- Also displayed the latest calculated enterprise value with current stock price and last financial report
REMINDER OF OSCILATOR USE:
Waves3: Indicated in RED Line(Upwards) and Green Line(Downwards)
- Detects wave greater than SMA
Waves4: Maximum height indicated in yellow Line
- Detects when wave greater than SMA (Wave 3 or 5) approaches wave 4 regression point
Waves5: Indicated in White Line
- Detects divergence in oscilator and price, meaning end of trend
Appreciate any suggestions, collaboration, comments or ideas.
- Detects Waves 2, 3 , 4 and 5
*Fib fan Wave 4 retracement
*Probability and target for wave 5
*Projection Wave 4 (if wave 3 detected)
*Projection Wave 5(if wave 4 detected)
*Alerts for Waves 2, 3, 4 and 5
*Fundamentals: Enterprise Value
*Better and accurate targets for waves based on Stocks
發行說明
Better and accurate dtection for Fib fan Wave 4 retracement發行說明
- Added Fibonnaci Trend Supports/Resistances for detected UpTrends and Downtrends(Red Line Fib and Green Line Fib)發行說明
- Better and accurate detection for WAVES 2,3,4 and 5- Much less graph noise overall
Fundamentals: Enterprise Value
- Calculated based on actual and historical financial data
- Gives a projection at where stock should be
- If stock is in its range, triangles are diplayed
- If stock is not in range, displays the projection
發行說明
Resolved error of indicator not working with some stocks for the financial data.僅限邀請腳本
只有經作者批准的使用者才能訪問此腳本。您需要申請並獲得使用權限。該權限通常在付款後授予。如欲了解更多詳情,請依照以下作者的說明操作,或直接聯絡edgartrader1396。
除非您完全信任其作者並了解腳本的工作原理,否則TradingView不建議您付費或使用腳本。您也可以在我們的社群腳本中找到免費的開源替代方案。
作者的說明
If you want free access, then please send me message with your request. Thank you!
Patreon(Scripts explanations, tutorials and Trading Setups) patreon.com/edgartrader
Paypal paypal.me/edgartorres947
Paypal paypal.me/edgartorres947
免責聲明
這些資訊和出版物並不意味著也不構成TradingView提供或認可的金融、投資、交易或其他類型的意見或建議。請在使用條款閱讀更多資訊。
僅限邀請腳本
只有經作者批准的使用者才能訪問此腳本。您需要申請並獲得使用權限。該權限通常在付款後授予。如欲了解更多詳情,請依照以下作者的說明操作,或直接聯絡edgartrader1396。
除非您完全信任其作者並了解腳本的工作原理,否則TradingView不建議您付費或使用腳本。您也可以在我們的社群腳本中找到免費的開源替代方案。
作者的說明
If you want free access, then please send me message with your request. Thank you!
Patreon(Scripts explanations, tutorials and Trading Setups) patreon.com/edgartrader
Paypal paypal.me/edgartorres947
Paypal paypal.me/edgartorres947
免責聲明
這些資訊和出版物並不意味著也不構成TradingView提供或認可的金融、投資、交易或其他類型的意見或建議。請在使用條款閱讀更多資訊。