OPEN-SOURCE SCRIPT
已更新 Twin Range Filter Visualized
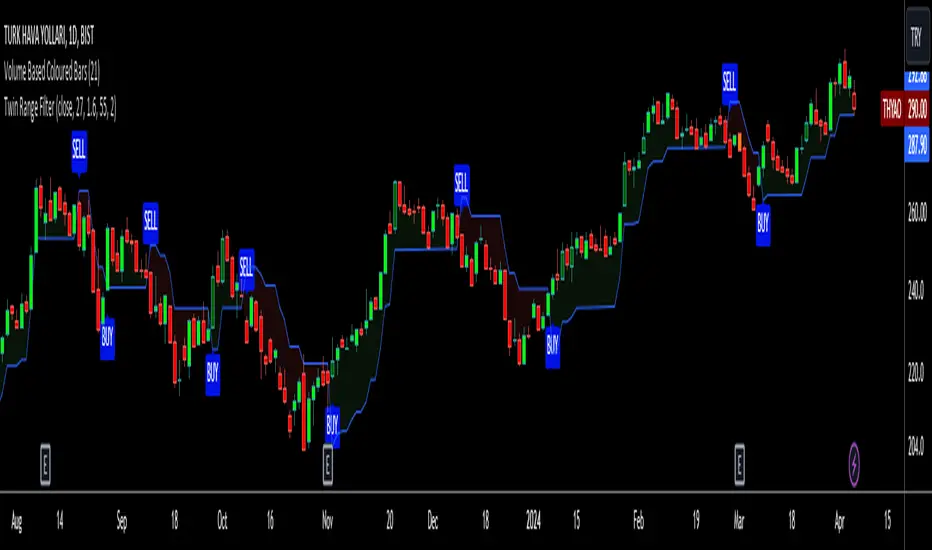
Visulaized version of colinmck's Twin Range Filter version on TradingView.
On colinmck's Twin Range Filter version, you can only see Long and Short signals on the chart.
But in this version of TRF, users can visually see the BUY and SELL signals on the chart with an added line of TRF.
TRF is an average of two smoothed Exponential Moving Averages, fast one has 27 bars of length and the slow one has 55 bars.
The purpose is to obtain two ranges that price fluctuates between (upper and lower range) and have LONG AND SHORT SIGNALS when close price crosses above the upper range and conversely crosses below lower range.
I personally combine the upper and lower ranges on one line to see the long and short signals with my own eyes so,
-BUY when price is higher or equal to the upper range level and the indicator line turns to draw the lower range to follow the price just under the bars as a trailing stop loss indicator like SuperTrend.
-SELL when price is lower or equal to the lower range levelline under the bars and then the indicator line turns to draw the upper range to follow the price just over the bars in that same trailing stop loss logic.
There are also two coefficients that adjusts the trailing line distance levels from the price multiplying the effect of the faster and slower moving averages.
The default values of the multipliers:
Fast range multiplier of Fast Moving Average(27): 1.6
Slow range multiplier of fSlow Moving Average(55): 2
Remember that if you enlarge these multipliers you will enlarge the ranges and have less but lagging signals. Conversely, decreasing the multipliers will have small ranges (line will get closer to the price and more signals will occur)
發行說明
Multiple Time Frame function added.開源腳本
本著TradingView的真正精神,此腳本的創建者將其開源,以便交易者可以查看和驗證其功能。向作者致敬!雖然您可以免費使用它,但請記住,重新發佈程式碼必須遵守我們的網站規則。
Telegram t.me/AlgoRhytm
YouTube (Turkish): youtube.com/c/kivancozbilgic
YouTube (English): youtube.com/c/AlgoWorld
YouTube (Turkish): youtube.com/c/kivancozbilgic
YouTube (English): youtube.com/c/AlgoWorld
免責聲明
這些資訊和出版物並不意味著也不構成TradingView提供或認可的金融、投資、交易或其他類型的意見或建議。請在使用條款閱讀更多資訊。
開源腳本
本著TradingView的真正精神,此腳本的創建者將其開源,以便交易者可以查看和驗證其功能。向作者致敬!雖然您可以免費使用它,但請記住,重新發佈程式碼必須遵守我們的網站規則。
Telegram t.me/AlgoRhytm
YouTube (Turkish): youtube.com/c/kivancozbilgic
YouTube (English): youtube.com/c/AlgoWorld
YouTube (Turkish): youtube.com/c/kivancozbilgic
YouTube (English): youtube.com/c/AlgoWorld
免責聲明
這些資訊和出版物並不意味著也不構成TradingView提供或認可的金融、投資、交易或其他類型的意見或建議。請在使用條款閱讀更多資訊。