OPEN-SOURCE SCRIPT
Bollinger Bands Fibonacci ratios
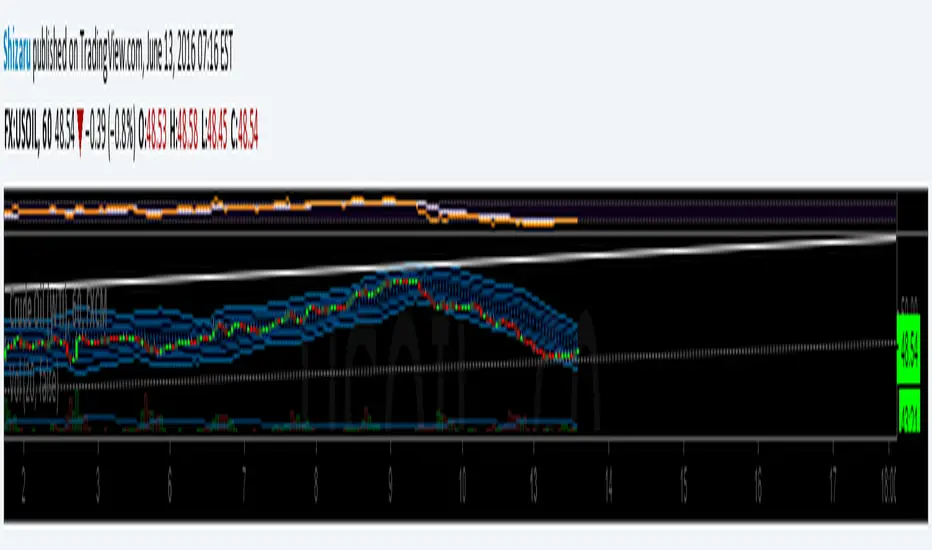
The Fibonacci Bollinger Bands indicator is based on the same principles as the standard Bollinger Bands indicator developed by John Bollinger. The Fibonacci Bollinger Bands indicator bases its upper and lower bands on volatility just like the Bollinger Bands indicator does, but instead of using standard deviation as the measure of volatility, a Wilders Smoothed ATR is used in its place.
The middle band is a moving average used to establish the intermediate-term trend. The 3 upper bands are constructed by using the Wilders Smoothed ATR and multiplying it by each of the Fibonacci factors (1.618, 2.618, and 4.236) and then adding the results to the middle band. The 3 lower bands are constructed in the same manner as the upper bands except their results are subtracted from the middle band.
The middle band is a moving average used to establish the intermediate-term trend. The 3 upper bands are constructed by using the Wilders Smoothed ATR and multiplying it by each of the Fibonacci factors (1.618, 2.618, and 4.236) and then adding the results to the middle band. The 3 lower bands are constructed in the same manner as the upper bands except their results are subtracted from the middle band.
開源腳本
本著TradingView的真正精神,此腳本的創建者將其開源,以便交易者可以查看和驗證其功能。向作者致敬!雖然您可以免費使用它,但請記住,重新發佈程式碼必須遵守我們的網站規則。
免責聲明
這些資訊和出版物並不意味著也不構成TradingView提供或認可的金融、投資、交易或其他類型的意見或建議。請在使用條款閱讀更多資訊。
免責聲明
這些資訊和出版物並不意味著也不構成TradingView提供或認可的金融、投資、交易或其他類型的意見或建議。請在使用條款閱讀更多資訊。