PROTECTED SOURCE SCRIPT
Market Sessions & Volume Profile [A0A_Indicator]
Description:
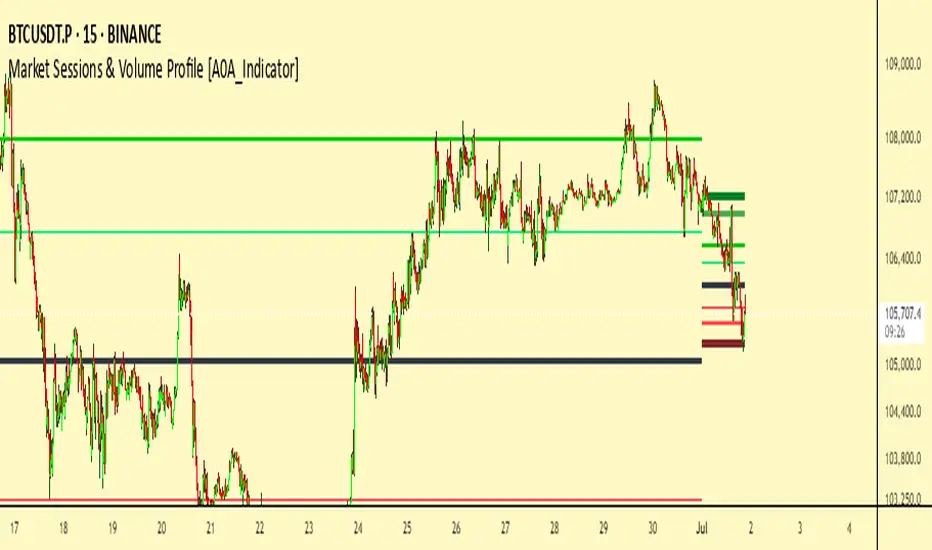
This advanced chart overlay is designed for traders who want maximum clarity in price formation and market structure. The tool visualizes the true market activity within individual sessions using multi-zonal approaches. It offers highly distinctive levels for both historically relevant and real-time trading ranges, all in a dynamic, adaptive visual structure.
What makes it unique:
Multiple layered price acceptance areas: Several tiers of market activity are shown, with each zone individually highlighted for optimal pattern recognition.
Session-adaptive boundaries: The displayed ranges adjust automatically depending on the trading session you select, for optimal relevance.
Precision liquidity markers: A central focus level is always marked and stands out clearly against the chart background.
Real-time adaptive: The profile responds immediately as new market data arrives, providing up-to-date structure and context.
Visual customization: All graphical features can be shown or hidden to match your personal analytical style.
Who should use this:
Anyone seeking to identify genuine value consensus, rejection extremes, and price memory zones within global trading hours—whether for intraday or swing analysis.
受保護腳本
此腳本以閉源形式發佈。 不過,您可以自由使用,沒有任何限制 — 點擊此處了解更多。
免責聲明
這些資訊和出版物並非旨在提供,也不構成TradingView提供或認可的任何形式的財務、投資、交易或其他類型的建議或推薦。請閱讀使用條款以了解更多資訊。
受保護腳本
此腳本以閉源形式發佈。 不過,您可以自由使用,沒有任何限制 — 點擊此處了解更多。
免責聲明
這些資訊和出版物並非旨在提供,也不構成TradingView提供或認可的任何形式的財務、投資、交易或其他類型的建議或推薦。請閱讀使用條款以了解更多資訊。