OPEN-SOURCE SCRIPT
已更新 User-Defined Volume Average Comparison
The User-Defined Volume Average Comparison indicator empowers traders to analyze volume trends by comparing short-term and long-term volume moving averages. With customizable periods, visual cues, and built-in alerts, it’s a versatile tool for identifying volume-driven market shifts across any timeframe, ideal for stocks, forex, crypto, and more.Key Features: Customizable Periods: Set short and long periods (in bars) to match your trading strategy.
Conditional Highlighting:
Green Background: Short-period volume average ≥ long-period volume average, signaling strong short-term volume.
Red Background: Short-period volume average < long-period volume average / 2, indicating low short-term volume.
Optional Labels: Toggle labels to display conditions on the chart (default: off).
Alerts: Receive notifications for key conditions: “Short ≥ Long Alert” for high volume periods.
“Short < Long/2 Alert” for low volume periods.
Visualized Averages: Plots short-period (blue) and long-period (red) volume moving averages for easy analysis.
How It Works:
The indicator calculates the simple moving average (SMA) of volume over user-defined short and long periods, then compares them: A green background and alert trigger when the short-period average meets or exceeds the long-period average, suggesting increased volume activity.
A red background and alert trigger when the short-period average falls below half of the long-period average, indicating reduced volume.
Labels (if enabled) display “Short ≥ Long” or “Short < Long/2” for clarity.
Settings: Short Period (Bars): Number of bars for the short-term volume average (default: 3).
Long Period (Bars): Number of bars for the long-term volume average (default: 50).
Show Labels: Enable or disable condition labels (default: off).
Use Cases: Trend Confirmation: Use green alerts to confirm high volume during breakouts or trend continuations.
Divergence Detection: Identify low volume periods with red alerts to spot potential reversals or weak trends.
Multi-Timeframe Analysis: Apply on any timeframe (e.g., 4H, 1D), with periods based on bars (e.g., 3 bars on 4H = 12 hours).
Notes: Periods are based on the chart’s timeframe (bars). For shorter timeframes, consider increasing period values for more significant results.
Set alerts to “Once Per Bar Close” for reliable notifications.
Combine with price-based indicators to enhance trading decisions.
Why Use This Indicator?
This indicator offers a flexible, alert-driven approach to volume analysis, helping traders of all levels make informed decisions. Its intuitive design and customizable settings make it a valuable addition to any trading setup.
發行說明
The User-Defined Volume Average Comparison indicator helps traders assess volume dynamics by comparing short-term and long-term volume averages. With customizable periods, visual cues, and built-in alerts, it offers a flexible and intuitive approach to volume-based market analysis across any asset class or timeframe.🔍 Key Features
- Customizable Periods:
Set short and long periods (in bars) to match your strategy and timeframe.
- Conditional Highlighting:
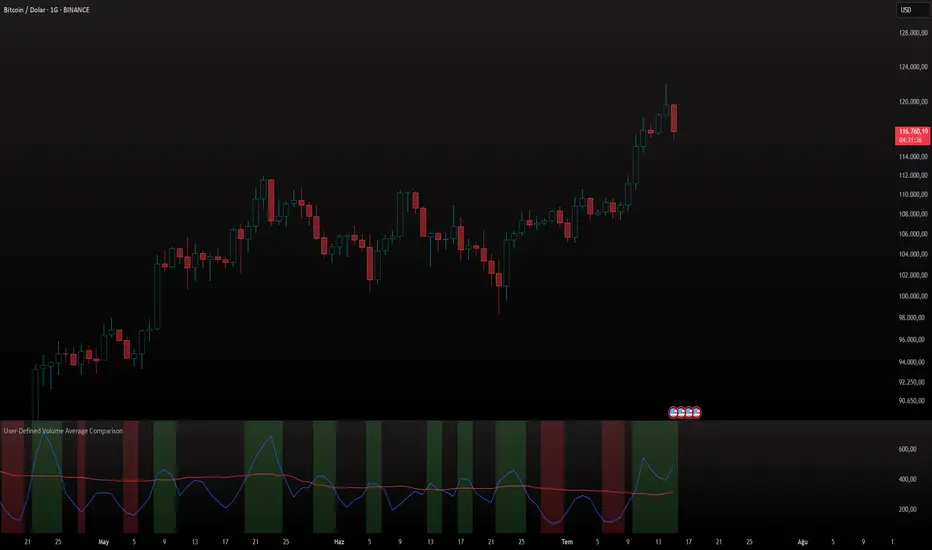
- 🟩 Green Background: Short-period volume average ≥ long-period average → strong short-term volume.
- 🟥 Red Background: Short-period volume average < half of long-period average → weak volume or potential exhaustion.
- Optional Labels:
Toggle chart labels to display conditions (“Short ≥ Long” or “Short < Long/2”) for clarity.
- Visualized Averages:
Plots short-period (blue) and long-period (red) volume moving averages for easy comparison.
- Alerts:
- “Short ≥ Long Alert” for high-volume conditions
- “Short < Long/2 Alert” for low-volume conditions
Alerts are configurable and designed to trigger once per bar close for reliability.
📊 How It Works
The indicator calculates the simple moving average (SMA) of volume over user-defined short and long periods. It then compares the two:
- If the short average ≥ long average → green background and alert
- If the short average < long average / 2 → red background and alert
- Labels (if enabled) display the condition on the chart
This logic helps traders quickly assess whether volume is expanding or contracting relative to recent history.
⚙️ Settings Overview
- Short Period (Bars): Default = 3
- Long Period (Bars): Default = 50
- Show Labels: Default = off
- Alert Conditions: Can be enabled individually
🧠 Use Cases
- Trend Confirmation:
Use green alerts to validate volume strength during breakouts or trend continuation.
- Divergence Detection:
Red alerts may signal weakening volume, potential reversals, or false breakouts.
- Multi-Timeframe Analysis:
Apply on any timeframe (e.g., 4H, 1D). Periods are bar-based (e.g., 3 bars on 4H = 12 hours).
- Screener Integration Tip:
For scanning, set the short period to 1 to reflect current bar volume directly. This allows the short average to act as a real-time volume proxy.
📋 Chart Simplicity
The published chart includes only the outputs of this indicator. No external indicators or unexplained drawings are present. All visual elements—volume averages, background highlights, and optional labels—are generated by the script itself and can be toggled via settings.
🧠 Notes for Traders
- Periods are based on the chart’s timeframe. For shorter timeframes, consider increasing period values for more meaningful comparisons.
- Alerts work best when set to “Once Per Bar Close.”
- Combine with price-based indicators for a more complete trading setup.
🧾 Compliance & Attribution
- Script authored by IQ-TRADER and published as open-source for transparency and community benefit.
- No external links or promotional content included.
- Fully aligned with TradingView’s House Rules and publishing guidelines.
開源腳本
秉持TradingView一貫精神,這個腳本的創作者將其設為開源,以便交易者檢視並驗證其功能。向作者致敬!您可以免費使用此腳本,但請注意,重新發佈代碼需遵守我們的社群規範。
免責聲明
這些資訊和出版物並非旨在提供,也不構成TradingView提供或認可的任何形式的財務、投資、交易或其他類型的建議或推薦。請閱讀使用條款以了解更多資訊。
免責聲明
這些資訊和出版物並非旨在提供,也不構成TradingView提供或認可的任何形式的財務、投資、交易或其他類型的建議或推薦。請閱讀使用條款以了解更多資訊。