INVITE-ONLY SCRIPT
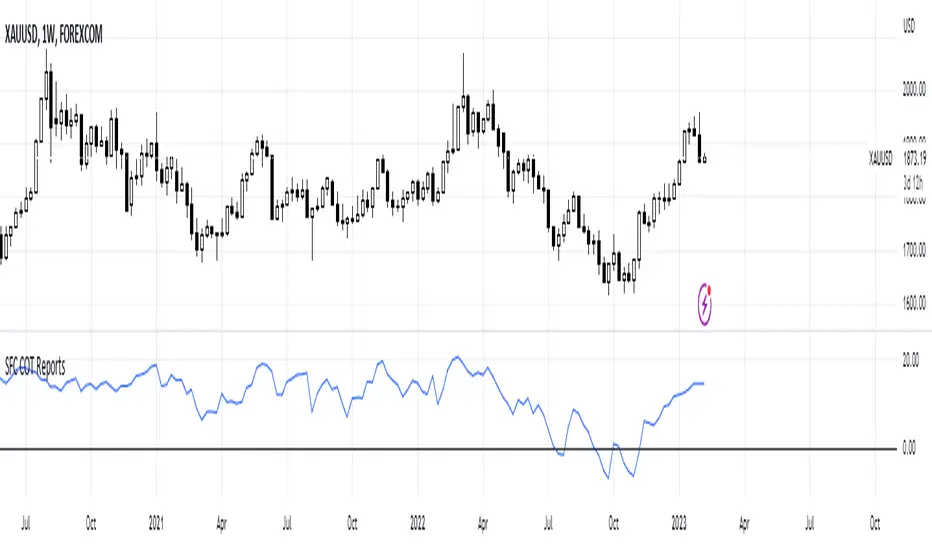
SFC True COT Reports
The Commodity Futures Trading Commission (Commission or CFTC) publishes the Commitments of Traders ( COT ) reports to help the public understand market dynamics. Specifically, the COT reports provide a breakdown of each Tuesday’s open interest for futures and options on futures markets in which 20 or more traders hold positions equal to or above the reporting levels established by the CFTC.
This indicator can display three similar, but also very different calculations:
- Net positions of the leveraged/managed Money
- COT Index
- COT True Index
Net Positions
The COT report is not a timing instrument. It shows us markets in which the trend remains stable OR where there could be a change in trend. But it does not give us clear information as to *WHEN* an entry into the market should take place.
Net positions are showing if the professional traders have bullish or bearish bias.
COT Index
After calculating the net positions, we are already one step further, but have not yet reached our goal. The net position itself does not tell us anything about how the commercials have actually positioned themselves. If we only know that the commercials are 15,782 contracts short this week, that does not help us much.
We need an indicator that lets us evaluate this figure. And we get it by relating the current position to the positions over a certain period. So, an index is calculated, that allows us to evaluate the current position as a percentage.
COT True Index
COT Index can give us very good idea how bullish or bearish are the professional traders, but it is limit to 0% and 100%. In this case an additional calculation is needed in order to remove this limitation and show us the true bias.
How to use the true index:
1) If the curve is below zero line means that the traders officially changed the bias from bullish to bearish . Before that we can consider that they are still bullish and price is retracing or consolidation, and vice versa
2) We can also measure the strength of the bias. For example if the curve is below zero line, but only few precent, we may consider that the bias is changing but it is still weak bearish bias.
3) We can use the chart to see where are the peaks and troughs. They are using as support and resistance and we can expect a general chance at these levels.
Supported pairs:
'XAUUSD' , 'XAGUSD' , 'COPPER' , 'PLATINUM' 'PALLADIUM';
'AUDUSD' ,'USDCAD' , 'GBPUSD' , 'EURUSD' , 'USDJPY' , 'DXY';
'US30USD' ,'SPX500USD' , 'NAS100USD';
'US02Y' , 'US05Y' , 'US10Y'
'BTCUSD'
Note: The curve of the US Yields is inverted, because actually shows the Bond market and not the Yields. This is not a problem, because Yields have perfect negative correlations with Bonds.
The indicator works only on weekly time frame.
僅限邀請腳本
僅作者批准的使用者才能訪問此腳本。您需要申請並獲得使用許可,通常需在付款後才能取得。更多詳情,請依照作者以下的指示操作,或直接聯絡SerpentForexClub。
TradingView不建議在未完全信任作者並了解其運作方式的情況下購買或使用腳本。您也可以在我們的社群腳本中找到免費的開源替代方案。
作者的說明
Reach me through PM system.
免責聲明
這些資訊和出版物並非旨在提供,也不構成TradingView提供或認可的任何形式的財務、投資、交易或其他類型的建議或推薦。請閱讀使用條款以了解更多資訊。
僅限邀請腳本
僅作者批准的使用者才能訪問此腳本。您需要申請並獲得使用許可,通常需在付款後才能取得。更多詳情,請依照作者以下的指示操作,或直接聯絡SerpentForexClub。
TradingView不建議在未完全信任作者並了解其運作方式的情況下購買或使用腳本。您也可以在我們的社群腳本中找到免費的開源替代方案。
作者的說明
Reach me through PM system.
免責聲明
這些資訊和出版物並非旨在提供,也不構成TradingView提供或認可的任何形式的財務、投資、交易或其他類型的建議或推薦。請閱讀使用條款以了解更多資訊。