PROTECTED SOURCE SCRIPT
已更新 Cuban's Candle Colouring

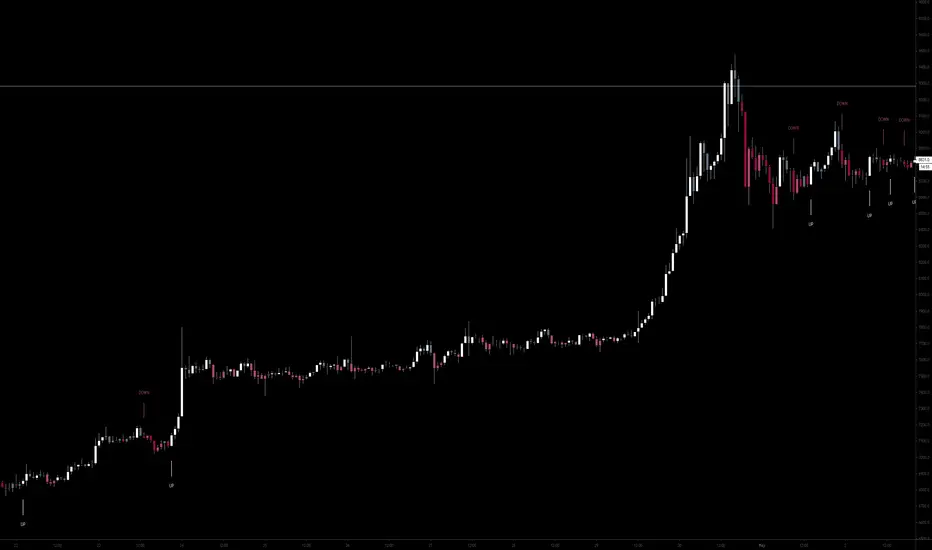
Using a complex combination of bullish/bearish candle structure (such as engulfings and breakouts) and moving averages, this indicator attempts to illustrate weakness and strength within a trending market.
Included are labels that highlight important breaks of micro structure levels.
The beauty of this script lies in the discretionary trading of 'mid-candle' colour changes, giving the trader a simple micro structure bias.
The white ( bullish ) and dark red ( bearish ) colours are the higher confluence indications of candle structure breakout and breakdown, with the grey (semi-bullish) and pink (semi-bearish) showing trend weakness.
發行說明
- Pine runtime fix
發行說明
- Extended max bars back
受保護腳本
此腳本以閉源形式發佈。 不過,您可以自由使用,沒有任何限制 — 點擊此處了解更多。
免責聲明
這些資訊和出版物並非旨在提供,也不構成TradingView提供或認可的任何形式的財務、投資、交易或其他類型的建議或推薦。請閱讀使用條款以了解更多資訊。
受保護腳本
此腳本以閉源形式發佈。 不過,您可以自由使用,沒有任何限制 — 點擊此處了解更多。
免責聲明
這些資訊和出版物並非旨在提供,也不構成TradingView提供或認可的任何形式的財務、投資、交易或其他類型的建議或推薦。請閱讀使用條款以了解更多資訊。