INVITE-ONLY SCRIPT
已更新 Market structure intraday ES futures strategy - BuySell Zones
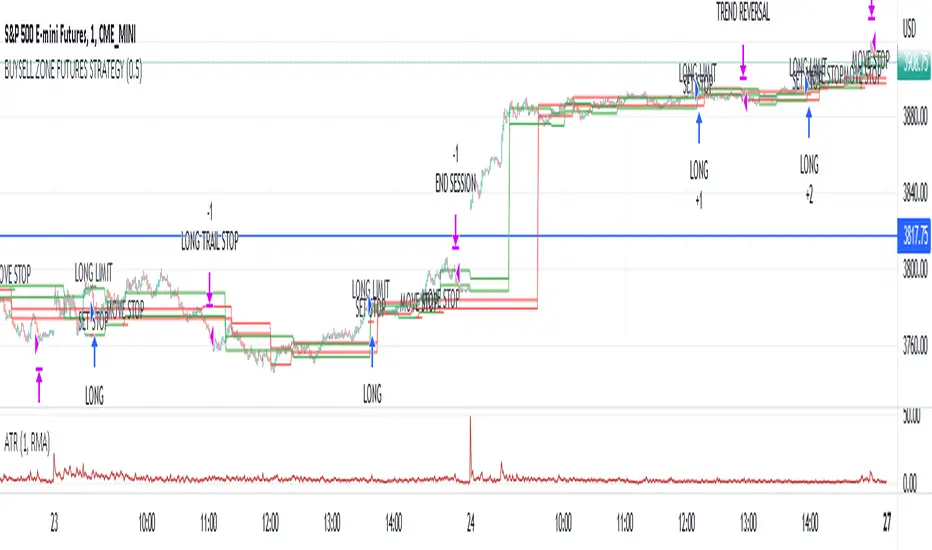
This market structure strategy for ES Mini Futures optimized for intraday market analysis ( RTH ).
Entry condition identified by bearish and bullish market structure.
Support level (Green Lines) is identified based on different variations of price fluctuations followed by the close above the range.
Resistance level (Red Lines) is identified based on different variations of price fluctuations followed by the close below the range.
The idea is to spot areas where market players were fighting for the best price and one side finally won.
Bullish trend is identified by consecutive series of support levels developing in upside direction.
Bearish trend is identified by consecutive series of resistance levels developing in downside direction.
When market develops bullish trend , strategy sets LONG limit order at fresh support level .
When market develops bearish trend , strategy sets SHORT limit order at fresh resistance level .
If there is an open position no new entries are performed.
For longs initial stop is set at previous support level adjusted by ATR.
For shorts stop is set at previous resistance level adjusted by ATR.
Stop trailing is also based on market structure.
If new support level is identified, stop moves to previous support level .
If new resistance level is identified, stop moves to previous resistance level .
There are no target. Strategy either gets stopped at current stop level or exits at session end.
Strategy calculates position size based on the previous market structure and ATR.
Strategy performs compounding position sizing so as account amount increases so does amount of traded contracts.
Usage:
Add script to your favorites and apply it on ES1! 1 minute time frame setting regular trading hours.
Script will print the limit order as well as stop levels according to the rules described above. As trade will progress, script will print levels to move the stop to.
Settings:
I added an option to disable the support and resistance lines printing if you prefer to have clean charts.
You can also change risk % to best fit your trading style.
If you just want to use the support and resistance levels as indicator you can also disable the strategy execution.
Support and Resistance indicator itself is universal and can be used on any market or timeframe.
If you want the strategy to be optimized for other markets or timeframes or have other rule set in mind feel free PM me, we will create the solution that best fits your needs and styles.
Real life trading is not get rich scheme. It is continuous process that involves various steps and dedication. If you are willing to take this path please PM me to enable the strategy for you.
Enjoy!
發行說明
Added control for position sizing to change base capital after every trade.Added previous trading setup cancellation when new trading setup is identified.
發行說明
Updated default settings發行說明
Fixed bearish opposing zone filter.Set the end of session to 3pm central to match the stock market.
發行說明
Updated default values發行說明
Fixed bearish Stop Loss Logic發行說明
Fixed re-entry after previous trade was stopped on confirmation bar發行說明
Fixed after hours entry發行說明
Added more room to trailed stop發行說明
Chart adjustment發行說明
Added exit on Trend reversal發行說明
Changed ATR to 40Added ATR based stop padding
發行說明
Added filter by Rollover Week僅限邀請腳本
僅作者批准的使用者才能訪問此腳本。您需要申請並獲得使用許可,通常需在付款後才能取得。更多詳情,請依照作者以下的指示操作,或直接聯絡cyberninjadroid。
TradingView不建議在未完全信任作者並了解其運作方式的情況下購買或使用腳本。您也可以在我們的社群腳本中找到免費的開源替代方案。
作者的說明
Please PM me for access
免責聲明
這些資訊和出版物並非旨在提供,也不構成TradingView提供或認可的任何形式的財務、投資、交易或其他類型的建議或推薦。請閱讀使用條款以了解更多資訊。
僅限邀請腳本
僅作者批准的使用者才能訪問此腳本。您需要申請並獲得使用許可,通常需在付款後才能取得。更多詳情,請依照作者以下的指示操作,或直接聯絡cyberninjadroid。
TradingView不建議在未完全信任作者並了解其運作方式的情況下購買或使用腳本。您也可以在我們的社群腳本中找到免費的開源替代方案。
作者的說明
Please PM me for access
免責聲明
這些資訊和出版物並非旨在提供,也不構成TradingView提供或認可的任何形式的財務、投資、交易或其他類型的建議或推薦。請閱讀使用條款以了解更多資訊。