OPEN-SOURCE SCRIPT
已更新 Ichimoku Kinko Hyo [DM]
Ichimoku Kinko Hyo PineV5
Definition
The Ichimoku Cloud is a package of multiple technical indicators that signal support, resistance, market trend, and market momentum. It is one of the few indicators out there that attempts to convey a number of meaningful insights into one. For that reason it can be hard to understand at first glance, but is commonly used among professional traders and market participants.
History
In the late 1960s, Goichi Hosada introduced the Ichimoku Cloud. It took several years for its adoption and understanding to take off, but today it is commonly known and used as an indicator in the field of technical analysis.
Calculations
The Ichimoku Cloud can be calculated in several different ways. It depends on your timeframe, needs, and expertise in technical analysis.
Takeaways
The Cloud is an integral part of the technical indicator as a whole and helps traders and investors identify the specific calculations made to the chart. Price below the cloud indicates a downward trend, whereas price above the cloud indicates an uptrend. These trend signals can strengthen if both the cloud and the price are moving in the same direction. Similarly, the signals can weaken if the cloud is moving in the opposite direction.
What to look for
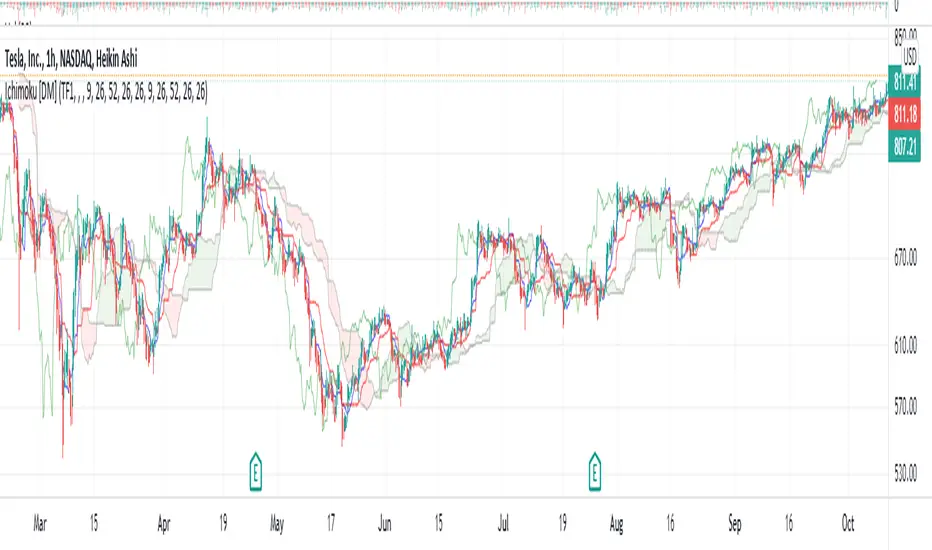
By using various averages, the Ichimoku Cloud indicator gives traders and investors key and extensive data information. Trends are high when price is above the cloud, weak when price is below the cloud, or transitioning when price is seen inside the cloud.
As was mentioned in the Calculation section above, when Leading Span A falls below Leading Span B, we can confirm a downtrend. The cloud, in this case, displays a red hue. When Leading Span A is above Leading Span B, we can confirm an uptrend. The cloud, in this case, displays a green hue.
The Ichimoku cloud can be used with other technical indicators in order to better assess risk. By looking at larger trends, with the help of multiple indicators, traders are able to see how smaller trends can fit within the general market picture as a whole.
Limitations
With all of the lines and cloud shading and data points, the chart can look a little crowded and stuffy. In order to work through this, there’s software that can hide these lines so the chart looks cleaner for traders and all the information you’d like to see is at the forefront of the chart. At TradingView, we have special features available for all our users. Anyone using our platform can pick which lines and backgrounds they’d like shown and can also customize the color, line thickness, and opacity with a simple click.
more info: ichimoku.org
Definition
The Ichimoku Cloud is a package of multiple technical indicators that signal support, resistance, market trend, and market momentum. It is one of the few indicators out there that attempts to convey a number of meaningful insights into one. For that reason it can be hard to understand at first glance, but is commonly used among professional traders and market participants.
History
In the late 1960s, Goichi Hosada introduced the Ichimoku Cloud. It took several years for its adoption and understanding to take off, but today it is commonly known and used as an indicator in the field of technical analysis.
Calculations
The Ichimoku Cloud can be calculated in several different ways. It depends on your timeframe, needs, and expertise in technical analysis.
Takeaways
The Cloud is an integral part of the technical indicator as a whole and helps traders and investors identify the specific calculations made to the chart. Price below the cloud indicates a downward trend, whereas price above the cloud indicates an uptrend. These trend signals can strengthen if both the cloud and the price are moving in the same direction. Similarly, the signals can weaken if the cloud is moving in the opposite direction.
What to look for
By using various averages, the Ichimoku Cloud indicator gives traders and investors key and extensive data information. Trends are high when price is above the cloud, weak when price is below the cloud, or transitioning when price is seen inside the cloud.
As was mentioned in the Calculation section above, when Leading Span A falls below Leading Span B, we can confirm a downtrend. The cloud, in this case, displays a red hue. When Leading Span A is above Leading Span B, we can confirm an uptrend. The cloud, in this case, displays a green hue.
The Ichimoku cloud can be used with other technical indicators in order to better assess risk. By looking at larger trends, with the help of multiple indicators, traders are able to see how smaller trends can fit within the general market picture as a whole.
Limitations
With all of the lines and cloud shading and data points, the chart can look a little crowded and stuffy. In order to work through this, there’s software that can hide these lines so the chart looks cleaner for traders and all the information you’d like to see is at the forefront of the chart. At TradingView, we have special features available for all our users. Anyone using our platform can pick which lines and backgrounds they’d like shown and can also customize the color, line thickness, and opacity with a simple click.
more info: ichimoku.org
發行說明
Added individual offset to Sensoku cloud (a and b) lines發行說明
Added Log Scale Option發行說明
Major changesAdded second time frame
Added second det of length
Added basic alerts
開源腳本
秉持TradingView一貫精神,這個腳本的創作者將其設為開源,以便交易者檢視並驗證其功能。向作者致敬!您可以免費使用此腳本,但請注意,重新發佈代碼需遵守我們的社群規範。
免責聲明
這些資訊和出版物並非旨在提供,也不構成TradingView提供或認可的任何形式的財務、投資、交易或其他類型的建議或推薦。請閱讀使用條款以了解更多資訊。
免責聲明
這些資訊和出版物並非旨在提供,也不構成TradingView提供或認可的任何形式的財務、投資、交易或其他類型的建議或推薦。請閱讀使用條款以了解更多資訊。