PROTECTED SOURCE SCRIPT
Range Plot
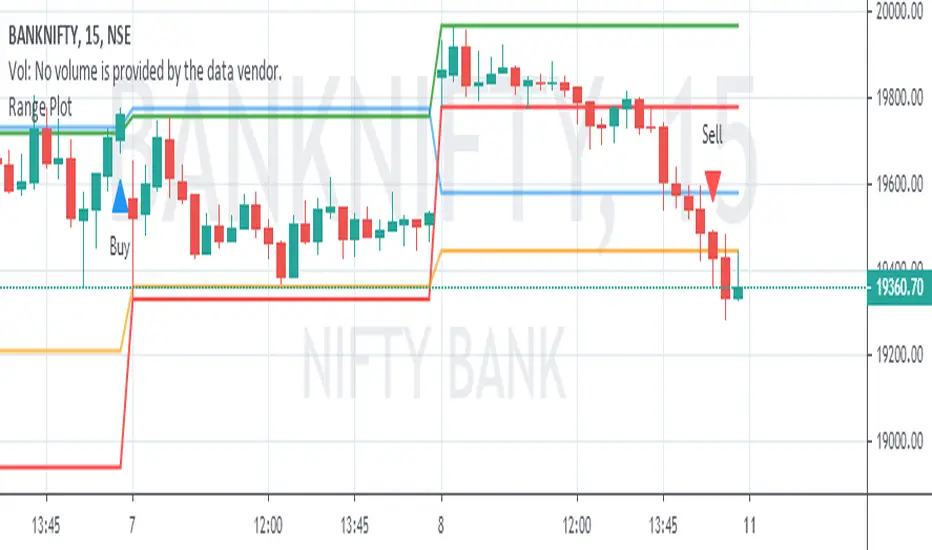
Today's first 75 minutes candle high in darker blue color and today's first 75 minutes candle low in darker red color.
Previous trading session last 75 minutes candle high in green color and previous trading session last 75 minutes candle low in orange color.
Today's marking are in blue n red little darker and previous day's last candle marking are in orange and red.
You are likely to familiar with the opening range of 5 min, 15 min, or even of 60 min also. In the opening range, we use today's' candle only. In the range plot, we have made a little addition of previous trading session last candle also. And we got very good results.
Price doesn't know what we have plotted. we just try to make our trading decisions around this area.
Range plot give very good signal in trending scripts and it helps to keep us out from ranging stock.
受保護腳本
此腳本以閉源形式發佈。 不過,您可以自由使用,沒有任何限制 — 點擊此處了解更多。
免責聲明
這些資訊和出版物並非旨在提供,也不構成TradingView提供或認可的任何形式的財務、投資、交易或其他類型的建議或推薦。請閱讀使用條款以了解更多資訊。
受保護腳本
此腳本以閉源形式發佈。 不過,您可以自由使用,沒有任何限制 — 點擊此處了解更多。
免責聲明
這些資訊和出版物並非旨在提供,也不構成TradingView提供或認可的任何形式的財務、投資、交易或其他類型的建議或推薦。請閱讀使用條款以了解更多資訊。