INVITE-ONLY SCRIPT
已更新 Universal Valuation System
Overview 🔍
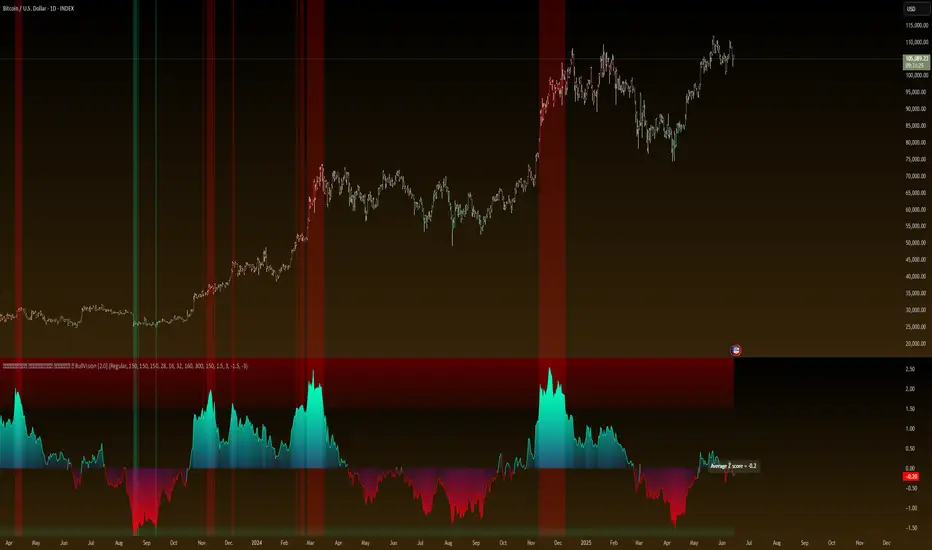
The Universal Valuation System (UVS) is an advanced valuation-focused indicator that provides insights into whether an asset is statistically overvalued or undervalued, helping traders understand where an asset sits within its historical value range. Unlike trend indicators, UVS emphasizes value analysis through a unique combination of performance ratios and statistical metrics, synthesizing this data into an overall Z-score. This score reflects the asset’s position within a typical normal distribution curve, allowing traders to make data-driven decisions based on historical valuation patterns.
Normal Distribution: A Statistical Foundation for Valuation 📊
The UVS leverages the normal distribution model as its core statistical framework. In a normal distribution, values tend to cluster around a central mean, with predictable probabilities for deviation. In financial markets, this means that most price or valuation levels hover around an average range, while extreme highs or lows are less frequent.
Under normal distribution:
Using Z-scores, UVS calculates where current valuation metrics fall relative to this distribution, identifying overvalued (above-average) or undervalued (below-average) zones. This helps traders interpret an asset’s relative value, showing whether it is more likely to revert toward its mean or is experiencing an exceptional deviation.
Key Components and Ratios in UVS 🔀
UVS includes a range of valuation metrics that work together to determine the Z-score:
Sharpe Ratio: Measures return relative to risk, offering insight into the quality of returns.
Sortino Ratio: Focuses on downside deviation, helping gauge negative returns’ impact.
Omega Ratio: Assesses the likelihood of gains versus losses, providing a risk-adjusted performance measure.
Crosby Ratio: Examines volatility patterns, adding dimension to the valuation signal.
VWAP (Volume-Weighted Average Price) Z-Score: Assesses price relative to volume, highlighting valuation when volume supports price movements.
Price ROC Z-Score: Uses the rate of price change to give a volatility-adjusted price movement signal.
By averaging these ratios, UVS forms a composite Z-score representing an overall valuation signal. This Z-score directly reflects the asset’s position within its historical distribution, indicating whether it’s in a typical, overbought, or oversold range.
DCA (Dollar-Cost Averaging) Application with UVS 💵
The UVS provides powerful insights for those using Dollar-Cost Averaging (DCA) by signaling periods when an asset may be overvalued or undervalued relative to its historical distribution. This model-based approach helps traders strategically adjust their DCA timing:
Valuation Zone Display and Accessibility 🌈
UVS includes several user-friendly display options, helping traders interpret its signals easily:
Composite Zone Highlighting: Displays overbought and oversold zones with color gradients, clearly visualizing statistical extremes.
Ratio Breakdown: Allows users to view individual Z-scores for each component, understanding the specific contributions to the overall valuation signal.
Color Blindness Mode: Offers multiple color settings to ensure clear interpretation across different visual needs.
Summary: Structured Value Analysis for Informed DCA Decisions
UVS is designed to be a reliable tool for traders looking to anchor their DCA and valuation-based strategies in statistical reality. By identifying valuation zones within a normal distribution framework, UVS enables a disciplined approach to asset accumulation based on relative value rather than price trends.
Important Note: UVS does not predict future performance. It provides a statistical view of historical valuation, which should be supplemented with additional analysis and risk management practices. Past patterns do not guarantee future results.
The Universal Valuation System (UVS) is an advanced valuation-focused indicator that provides insights into whether an asset is statistically overvalued or undervalued, helping traders understand where an asset sits within its historical value range. Unlike trend indicators, UVS emphasizes value analysis through a unique combination of performance ratios and statistical metrics, synthesizing this data into an overall Z-score. This score reflects the asset’s position within a typical normal distribution curve, allowing traders to make data-driven decisions based on historical valuation patterns.
Normal Distribution: A Statistical Foundation for Valuation 📊
The UVS leverages the normal distribution model as its core statistical framework. In a normal distribution, values tend to cluster around a central mean, with predictable probabilities for deviation. In financial markets, this means that most price or valuation levels hover around an average range, while extreme highs or lows are less frequent.
Under normal distribution:
- 68% of values lie within one standard deviation of the mean.
- 95% of values lie within two standard deviations.
- 99.7% of values lie within three standard deviations.
Using Z-scores, UVS calculates where current valuation metrics fall relative to this distribution, identifying overvalued (above-average) or undervalued (below-average) zones. This helps traders interpret an asset’s relative value, showing whether it is more likely to revert toward its mean or is experiencing an exceptional deviation.
Key Components and Ratios in UVS 🔀
UVS includes a range of valuation metrics that work together to determine the Z-score:
Sharpe Ratio: Measures return relative to risk, offering insight into the quality of returns.
Sortino Ratio: Focuses on downside deviation, helping gauge negative returns’ impact.
Omega Ratio: Assesses the likelihood of gains versus losses, providing a risk-adjusted performance measure.
Crosby Ratio: Examines volatility patterns, adding dimension to the valuation signal.
VWAP (Volume-Weighted Average Price) Z-Score: Assesses price relative to volume, highlighting valuation when volume supports price movements.
Price ROC Z-Score: Uses the rate of price change to give a volatility-adjusted price movement signal.
By averaging these ratios, UVS forms a composite Z-score representing an overall valuation signal. This Z-score directly reflects the asset’s position within its historical distribution, indicating whether it’s in a typical, overbought, or oversold range.
DCA (Dollar-Cost Averaging) Application with UVS 💵
The UVS provides powerful insights for those using Dollar-Cost Averaging (DCA) by signaling periods when an asset may be overvalued or undervalued relative to its historical distribution. This model-based approach helps traders strategically adjust their DCA timing:
- Overvalued (Overbought) Zones:
- Undervalued (Oversold) Zones:
Valuation Zone Display and Accessibility 🌈
UVS includes several user-friendly display options, helping traders interpret its signals easily:
Composite Zone Highlighting: Displays overbought and oversold zones with color gradients, clearly visualizing statistical extremes.
Ratio Breakdown: Allows users to view individual Z-scores for each component, understanding the specific contributions to the overall valuation signal.
Color Blindness Mode: Offers multiple color settings to ensure clear interpretation across different visual needs.
Summary: Structured Value Analysis for Informed DCA Decisions
UVS is designed to be a reliable tool for traders looking to anchor their DCA and valuation-based strategies in statistical reality. By identifying valuation zones within a normal distribution framework, UVS enables a disciplined approach to asset accumulation based on relative value rather than price trends.
Important Note: UVS does not predict future performance. It provides a statistical view of historical valuation, which should be supplemented with additional analysis and risk management practices. Past patterns do not guarantee future results.
發行說明
Updated to v6發行說明
Updated code 發行說明
Visual update 僅限邀請腳本
僅作者批准的使用者才能訪問此腳本。您需要申請並獲得使用許可,通常需在付款後才能取得。更多詳情,請依照作者以下的指示操作,或直接聯絡BullVisionCapital。
TradingView不建議在未完全信任作者並了解其運作方式的情況下購買或使用腳本。您也可以在我們的社群腳本中找到免費的開源替代方案。
作者的說明
DM on TradingView or visit my website for direct access
🚀 Elevate your edge with institutional-grade indicators & full trading systems.
🔗 Access tools: linktr.ee/0xKazo
🔗 Access tools: linktr.ee/0xKazo
免責聲明
這些資訊和出版物並非旨在提供,也不構成TradingView提供或認可的任何形式的財務、投資、交易或其他類型的建議或推薦。請閱讀使用條款以了解更多資訊。
僅限邀請腳本
僅作者批准的使用者才能訪問此腳本。您需要申請並獲得使用許可,通常需在付款後才能取得。更多詳情,請依照作者以下的指示操作,或直接聯絡BullVisionCapital。
TradingView不建議在未完全信任作者並了解其運作方式的情況下購買或使用腳本。您也可以在我們的社群腳本中找到免費的開源替代方案。
作者的說明
DM on TradingView or visit my website for direct access
🚀 Elevate your edge with institutional-grade indicators & full trading systems.
🔗 Access tools: linktr.ee/0xKazo
🔗 Access tools: linktr.ee/0xKazo
免責聲明
這些資訊和出版物並非旨在提供,也不構成TradingView提供或認可的任何形式的財務、投資、交易或其他類型的建議或推薦。請閱讀使用條款以了解更多資訊。