OPEN-SOURCE SCRIPT
Frog in Pan Indicator
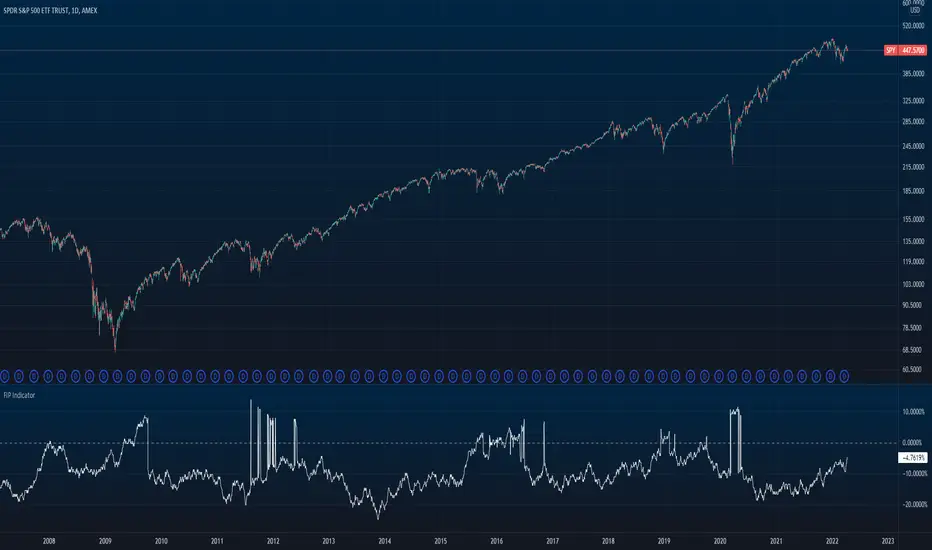
What is it?
This indicator is the percent of negative days minus the percent of positive days in a year multiplied by the sign of the overall return of the lookback (365 days for crypto and 252 days for stocks).
FIP = sign(return of lookback) * [% negative - % positive]
What is it used for?
This indicator is used as a quality screener for momentum stocks. It is based behind the ideas in Wesley Gray & Jack Vogel's book: Quantitative Momentum: A Practitioner's Guide to Building a Momentum-Based Stock Selection System that iterates that quality momentum stocks consist of steady uptrends (where more days are positive rather than negative) as opposed to characteristics of "lottery-like" stocks that are "jumpy" and more volatile. More research behind this indicator can be found here
How to use
In the indicator settings, the default lookback parameter is set to 365 days for analysis on cryptocurrencies and was used on a daily timeframe. If you want to use this indicator on individual stocks, it is best to change this lookback to 252 days. The more negative the value is, the higher quality of momentum it is.
開源腳本
秉持TradingView一貫精神,這個腳本的創作者將其設為開源,以便交易者檢視並驗證其功能。向作者致敬!您可以免費使用此腳本,但請注意,重新發佈代碼需遵守我們的社群規範。
免責聲明
這些資訊和出版物並非旨在提供,也不構成TradingView提供或認可的任何形式的財務、投資、交易或其他類型的建議或推薦。請閱讀使用條款以了解更多資訊。
開源腳本
秉持TradingView一貫精神,這個腳本的創作者將其設為開源,以便交易者檢視並驗證其功能。向作者致敬!您可以免費使用此腳本,但請注意,重新發佈代碼需遵守我們的社群規範。
免責聲明
這些資訊和出版物並非旨在提供,也不構成TradingView提供或認可的任何形式的財務、投資、交易或其他類型的建議或推薦。請閱讀使用條款以了解更多資訊。