INVITE-ONLY SCRIPT
Price Action based indicator to visualize waves and trends
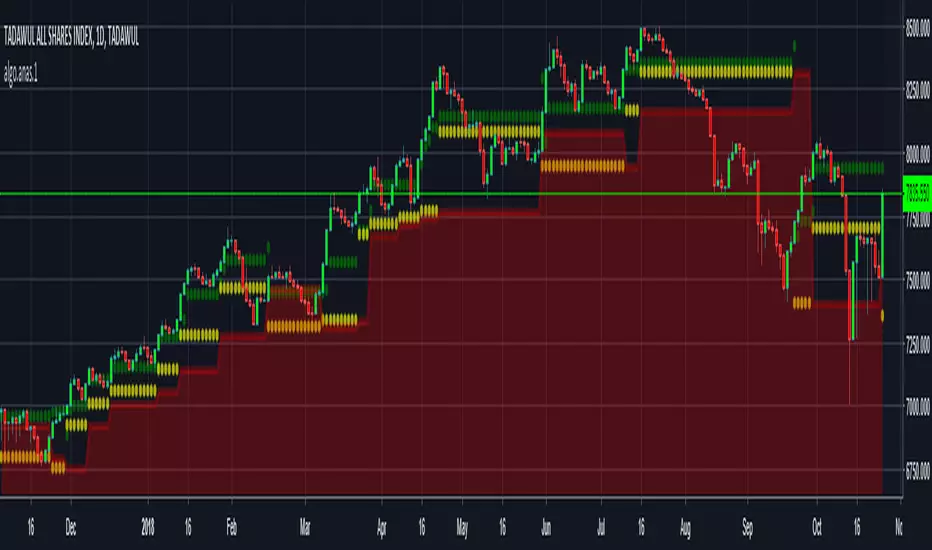
ANAS indicator is a proprietary script that quickly analyze price action and plot 3 price levels around each bar. Namely, green level, yellow level, and red zone. You will easily be able to identify current trend, support/resistance levels, wave count, targets and stops by studying different patterns and scenarios evolving around each bar. When applying the indicator to the same symbol on two different time frames, you differently got an edge!
Nothing can explain things more than giving it a try.
Nothing can explain things more than giving it a try.
免責聲明
這些資訊和出版物並非旨在提供,也不構成TradingView提供或認可的任何形式的財務、投資、交易或其他類型的建議或推薦。請閱讀使用條款以了解更多資訊。