PROTECTED SOURCE SCRIPT
已更新 BT Bar - 1.0
BTBar Description
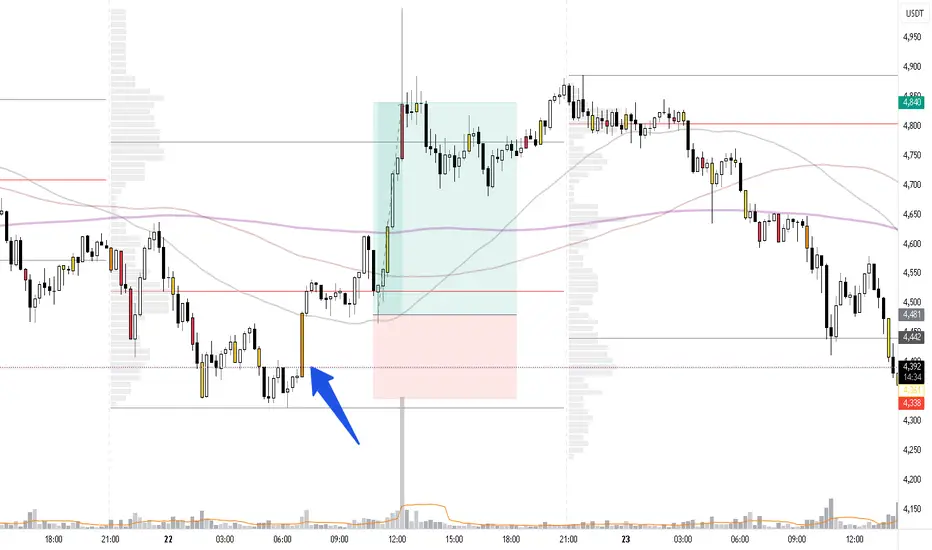
BTBar is a visual script designed to identify and highlight candles with abnormally high volume, making it easier for traders to spot pressure imbalances and key price areas during live market action.
🔍 The script compares the current candle’s volume to the previous one, and highlights candles that exceed specific percentage thresholds (customizable by the user) using distinct colors.
Rather than relying on generic trend or scalping strategies, BTBar is based on relative volume intensity detection — a concept rooted in order flow analysis — to help traders identify:
Candles with unusual volume spikes (possible absorption or exhaustion),
Medium/high volume continuation signals,
Areas where price might reverse or accelerate.
🛠️ It also offers the option to automatically draw horizontal lines from the open of the highest-volume candles, helping traders track potential institutional decision levels throughout the day.
⚙️ How to use:
Apply BTBar to a clean chart.
Customize the volume threshold levels (e.g., 300%, 400%, etc.).
Watch for highlighted candles — these indicate moments when volume significantly broke previous levels, marking potential points of interest or behavior shifts.
Use the optional horizontal lines as visual support/resistance levels derived from volume extremes.
🧠 Underlying concept:
BTBar uses a percentage-based volume comparison approach, inspired by techniques in footprint charts and volume spike detection.
This allows traders to visually spot key market reactions without relying on numeric overload or complex setups.
發行說明
BTBar DescriptionBTBar is a visual script designed to identify and highlight candles with abnormally high volume, making it easier for traders to spot pressure imbalances and key price areas during live market action.
🔍 The script compares the current candle’s volume to the previous one, and highlights candles that exceed specific percentage thresholds (customizable by the user) using distinct colors.
Rather than relying on generic trend or scalping strategies, BTBar is based on relative volume intensity detection — a concept rooted in order flow analysis — to help traders identify:
Candles with unusual volume spikes (possible absorption or exhaustion),
Medium/high volume continuation signals,
Areas where price might reverse or accelerate.
🛠️ It also offers the option to automatically draw horizontal lines from the open of the highest-volume candles, helping traders track potential institutional decision levels throughout the day.
⚙️ How to use:
Apply BTBar to a clean chart.
Customize the volume threshold levels (e.g., 300%, 400%, etc.).
Watch for highlighted candles — these indicate moments when volume significantly broke previous levels, marking potential points of interest or behavior shifts.
Use the optional horizontal lines as visual support/resistance levels derived from volume extremes.
🧠 Underlying concept:
BTBar uses a percentage-based volume comparison approach, inspired by techniques in footprint charts and volume spike detection.
This allows traders to visually spot key market reactions without relying on numeric overload or complex setups.
受保護腳本
此腳本以閉源形式發佈。 不過,您可以自由使用,沒有任何限制 — 點擊此處了解更多。
免責聲明
這些資訊和出版物並非旨在提供,也不構成TradingView提供或認可的任何形式的財務、投資、交易或其他類型的建議或推薦。請閱讀使用條款以了解更多資訊。
受保護腳本
此腳本以閉源形式發佈。 不過,您可以自由使用,沒有任何限制 — 點擊此處了解更多。
免責聲明
這些資訊和出版物並非旨在提供,也不構成TradingView提供或認可的任何形式的財務、投資、交易或其他類型的建議或推薦。請閱讀使用條款以了解更多資訊。