OPEN-SOURCE SCRIPT
已更新 High-Low of X Bar
Overview
Key Features
Inputs
Color Settings
Usage Instructions
Notes
- The High-Low of X Bar indicator allows traders to visualize historical high and low values from a specific number of bars ago directly on the chart.
- Provides insight into past price action by displaying high, low, and their difference at the most recent bar.
- Customizable inputs and color settings for labels enhance usability and visual integration with your chart.
Key Features
- Historical Data Analysis: Displays the high, low, and the difference between these values from a specified number of bars ago.
- Customizable Inputs: Set the number of bars ago to review historical price points, with a range from 1 to 2000 bars. Premium users can exceed this range.
- Dynamic Labeling: Option to show high, low, and difference values as labels on the chart, with customizable text and background colors.
- Color Customization: Customize label colors for high, low, and difference values, as well as for cases with insufficient bars.
Inputs
- Number of Bars Ago: Enter the number of bars back from the current bar to analyze historical high and low values.
- Show High Value: Toggle to display the historical high value.
- Show Low Value: Toggle to display the historical low value.
- Show Difference Value: Toggle to display the difference between high and low values.
Color Settings
- High Label Background Color: Set the background color of the high value label.
- High Label Text Color: Choose the text color for the high value label.
- Low Label Background Color: Set the background color of the low value label.
- Low Label Text Color: Choose the text color for the low value label.
- Difference Label Background Color: Set the background color of the difference label.
- Difference Label Text Color: Choose the text color for the difference label.
- Not Enough Bars Label Background Color: Set the background color for the label shown when there are insufficient bars.
- Not Enough Bars Label Text Color: Choose the text color for the insufficient bars label.
Usage Instructions
- Add to Chart: Apply the High-Low of X Bar indicator to your TradingView chart.
- Configure Settings: Adjust the number of bars ago and display options according to your analysis needs.
- Customize Appearance: Set the colors for the labels to match your chart's style.
- Analyze: Review the high, low, and their difference directly on your chart for immediate insights into past price movements.
Notes
- Ensure your chart has sufficient historical data for the indicator to function properly.
- Customize label visibility and colors based on your preference and trading strategy.
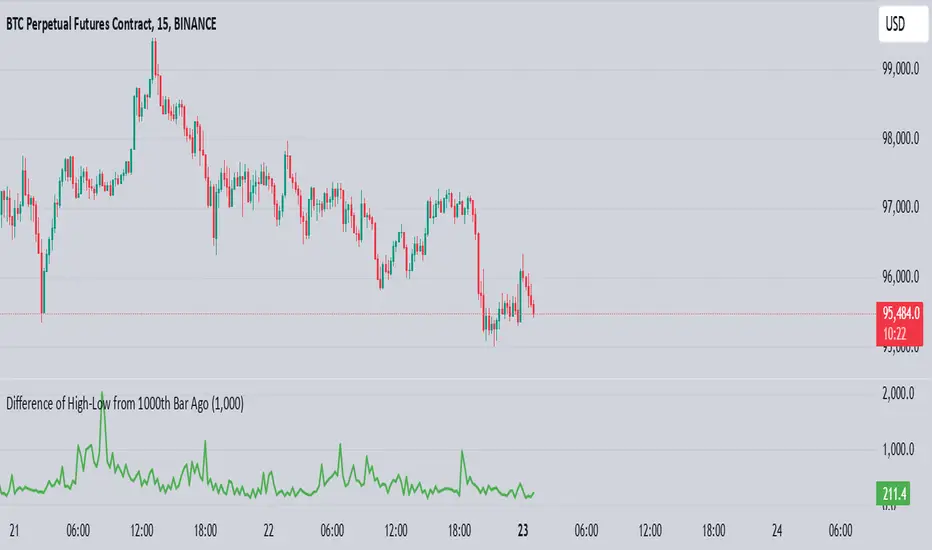
發行說明
Added a line chart to visualize the difference of high and low if X (e.g., 1000th) bar from the current one. X can be adjusted as needed. 開源腳本
秉持TradingView一貫精神,這個腳本的創作者將其設為開源,以便交易者檢視並驗證其功能。向作者致敬!您可以免費使用此腳本,但請注意,重新發佈代碼需遵守我們的社群規範。
免責聲明
這些資訊和出版物並非旨在提供,也不構成TradingView提供或認可的任何形式的財務、投資、交易或其他類型的建議或推薦。請閱讀使用條款以了解更多資訊。
開源腳本
秉持TradingView一貫精神,這個腳本的創作者將其設為開源,以便交易者檢視並驗證其功能。向作者致敬!您可以免費使用此腳本,但請注意,重新發佈代碼需遵守我們的社群規範。
免責聲明
這些資訊和出版物並非旨在提供,也不構成TradingView提供或認可的任何形式的財務、投資、交易或其他類型的建議或推薦。請閱讀使用條款以了解更多資訊。