PROTECTED SOURCE SCRIPT
Green Line Breakout (GLB)
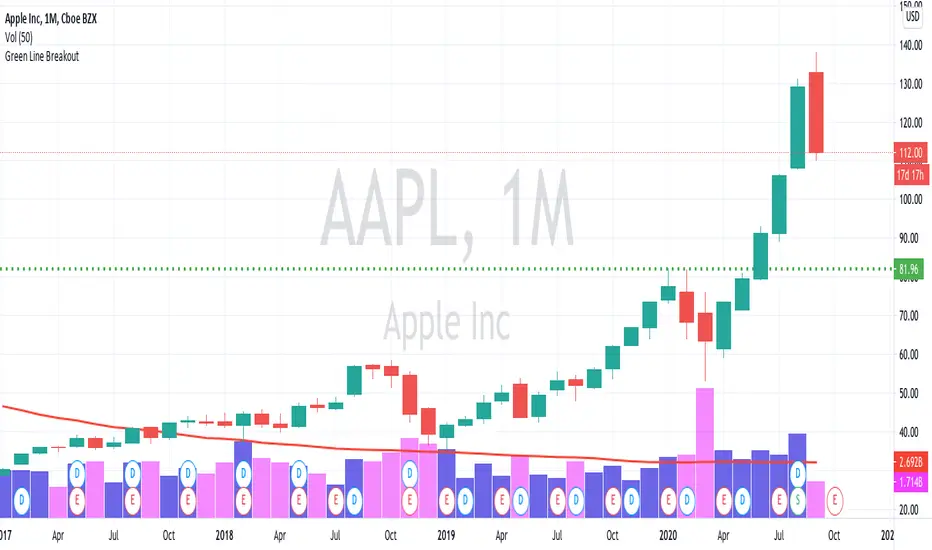
This is an implementation of Green Line Breakout (GLB) which is popularized by Eric Wish through his Wishing Wealth Blog.
GLB indicator looks at a monthly chart for a stock that hit a new all time high recently and draw a green horizontal line at the highest price reached at any month, that has not been surpassed for at least 3 months.
In other words, this method finds stock that reached an all-time high and has then rested for at least three months. When a stock moves through the green line or is above its last green line, it is an indication of strong buying interest.
Read more about how to use the indicator in Wishing Wealth Blog.
Usage Explanation:
1. Set the time frame to Monthly for a stock and automatically a green dashed line appears based on the calculation explained above
2. If no GLB found for a stock, then green line appears at 0.0
2. If you set any other time frame other than Monthly, no Green Dashed line shown
受保護腳本
此腳本以閉源形式發佈。 不過,您可以自由使用,沒有任何限制 — 點擊此處了解更多。
免責聲明
這些資訊和出版物並非旨在提供,也不構成TradingView提供或認可的任何形式的財務、投資、交易或其他類型的建議或推薦。請閱讀使用條款以了解更多資訊。
受保護腳本
此腳本以閉源形式發佈。 不過,您可以自由使用,沒有任何限制 — 點擊此處了解更多。
免責聲明
這些資訊和出版物並非旨在提供,也不構成TradingView提供或認可的任何形式的財務、投資、交易或其他類型的建議或推薦。請閱讀使用條款以了解更多資訊。