PROTECTED SOURCE SCRIPT
Pascal's Market Compression Oscillator
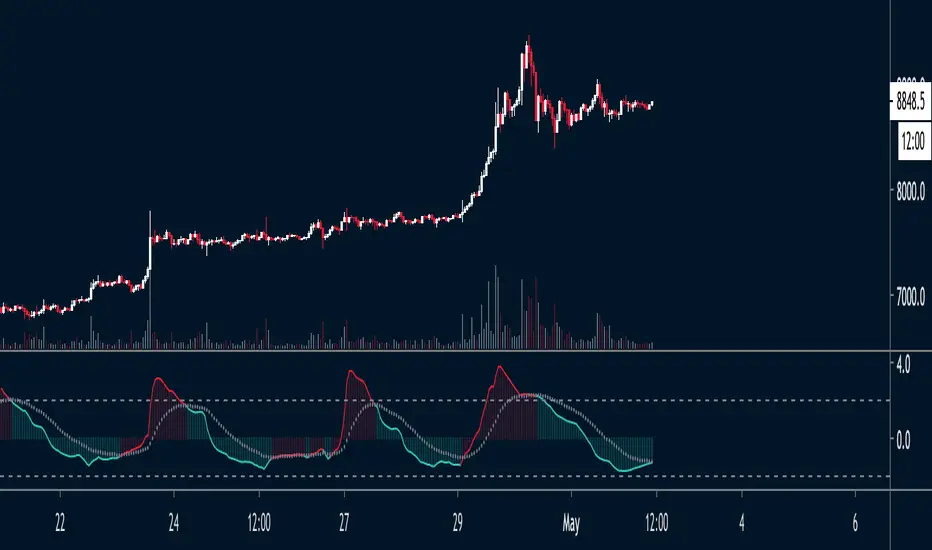
The indicator uses a standardized measure of volume and volatility to visualize the compression state of the market.
- Green: Market is currently compressing
- Red: Market is currently expanding
When the oscillator flips from Green to Red, the market is likely to enter a phase of expansion. This opens a window of opportunity for momentum strategies.
When the oscillator flips from Red to Green, the market is likely to enter a phase of compression. This makes it a favorable regime for mean reversion strategies.
Finally, please note that the indicator is NOT meant for directional analysis. e.g. when the oscillator signals "expansion", that can be up OR down.
受保護腳本
此腳本以閉源形式發佈。 不過,您可以自由使用,沒有任何限制 — 點擊此處了解更多。
免責聲明
這些資訊和出版物並非旨在提供,也不構成TradingView提供或認可的任何形式的財務、投資、交易或其他類型的建議或推薦。請閱讀使用條款以了解更多資訊。
受保護腳本
此腳本以閉源形式發佈。 不過,您可以自由使用,沒有任何限制 — 點擊此處了解更多。
免責聲明
這些資訊和出版物並非旨在提供,也不構成TradingView提供或認可的任何形式的財務、投資、交易或其他類型的建議或推薦。請閱讀使用條款以了解更多資訊。