PROTECTED SOURCE SCRIPT
Traders Dynamic Index
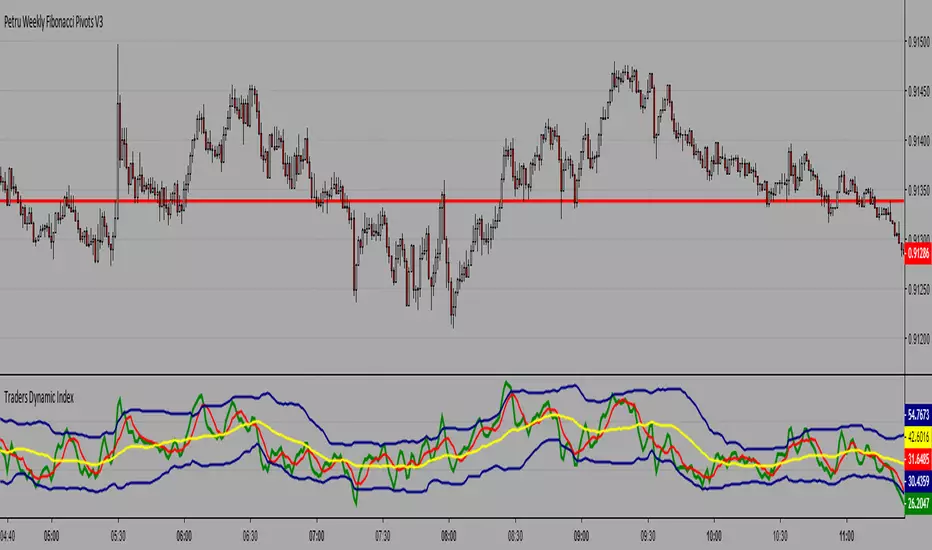
At a first glance, Traders Dynamic Index is not too easy to use, but you will get accustomed to it:
For scalping, enter long when the green line is above the red line and enter short when the red line is the above green line.
For short-term trading, enter long when the green is above both the red and the yellow lines; enter short when the red one is above both the green and the yellow ones.
For medium-term trading, go long under the same conditions as for the short-term trading but only when all lines are below 50; to go short — the same but above 50.
8
Mind the blue volatility band as it points to the long-term trend strength and volatility when wide. Steep green line changes also signal short-term market volatility.
受保護腳本
此腳本以閉源形式發佈。 不過,您可以自由使用,沒有任何限制 — 點擊此處了解更多。
免責聲明
這些資訊和出版物並非旨在提供,也不構成TradingView提供或認可的任何形式的財務、投資、交易或其他類型的建議或推薦。請閱讀使用條款以了解更多資訊。
受保護腳本
此腳本以閉源形式發佈。 不過,您可以自由使用,沒有任何限制 — 點擊此處了解更多。
免責聲明
這些資訊和出版物並非旨在提供,也不構成TradingView提供或認可的任何形式的財務、投資、交易或其他類型的建議或推薦。請閱讀使用條款以了解更多資訊。