INVITE-ONLY SCRIPT
Top Catcher | QR
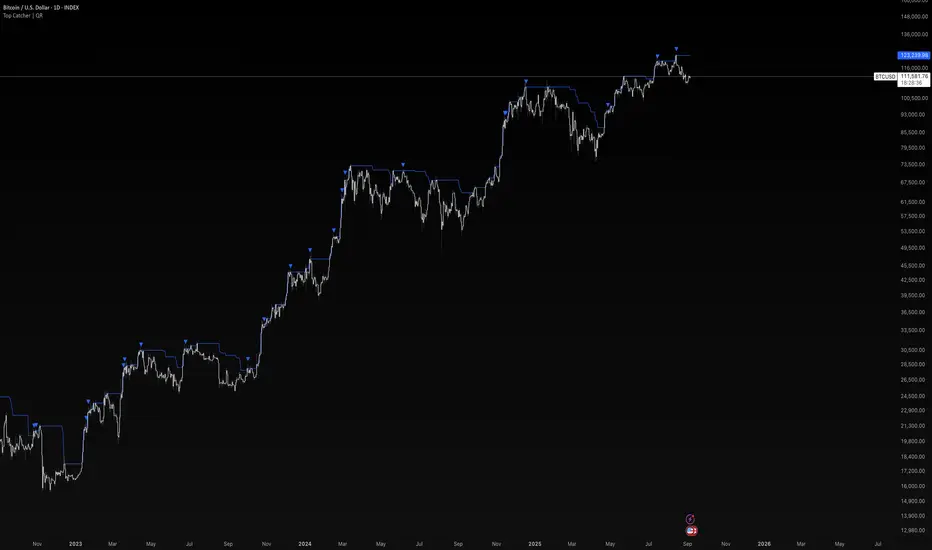
Top Catcher | QuantumResearch
The Top Catcher indicator is designed to help traders spot areas where markets may be forming local tops. Instead of relying on simple overbought measures like RSI or Bollinger Bands, it combines percentile-based price extremes with a volatility-adjusted filter. This approach helps highlight situations where price has stretched unusually far and then shows signs of weakness.
🔍 How It Works (Principle)
Percentile Analysis: The script measures whether price has reached an extreme compared to its recent distribution (very high percentile).
Volatility Confirmation: It checks if price fails to sustain above a volatility-adjusted upper boundary.
Signal Generation: Only when both conditions align does the script mark a potential Top with a visual triangle above the bar.
This dual-layer approach aims to reduce false signals often triggered in strong trends by single-metric tools.
🎯 Key Features
Top Signals: Plots a clear triangle above candles when potential exhaustion is detected.
Dynamic Adaptation: Works across different assets and timeframes by adjusting to each market’s own volatility.
Visual Overlay: Signals are plotted directly on the chart for intuitive reading.
Alert Ready: Built-in alerts let traders get notified as soon as a new Top signal is generated.
📈 How To Use
Trend Traders: Use signals to tighten stops or take partial profits in extended runs.
Swing Traders: Watch for reversal setups at local highs.
Multi-Timeframe Approach: Combine higher timeframe signals with intraday charts for confirmation.
The script is not meant to predict exact tops, but rather to provide an early warning of distribution zones where risk increases.
⚠️ Disclaimer
This tool is provided for educational and research purposes only. It is not financial advice. Past performance does not predict or guarantee future results. Always combine this tool with your own analysis and risk management.
僅限邀請腳本
只有經作者批准的使用者才能訪問此腳本。您需要申請並獲得使用權限。該權限通常在付款後授予。如欲了解更多詳情,請依照以下作者的說明操作,或直接聯絡QuantumResearch。
除非您完全信任其作者並了解腳本的工作原理,否則TradingView不建議您付費或使用腳本。您也可以在我們的社群腳本中找到免費的開源替代方案。
作者的說明
Access this script here: https://whop.com/quantum-whop/
🌐 Gain access to our cutting-edge tools:
whop.com/quantum-whop/
⚒️ Get access to our toolbox here for free:
quantumresearchportfolio.carrd.co
All tools and content provided are for informational and educational purposes only.
whop.com/quantum-whop/
⚒️ Get access to our toolbox here for free:
quantumresearchportfolio.carrd.co
All tools and content provided are for informational and educational purposes only.
免責聲明
這些資訊和出版物並不意味著也不構成TradingView提供或認可的金融、投資、交易或其他類型的意見或建議。請在使用條款閱讀更多資訊。