PROTECTED SOURCE SCRIPT
🔵Blue Mark
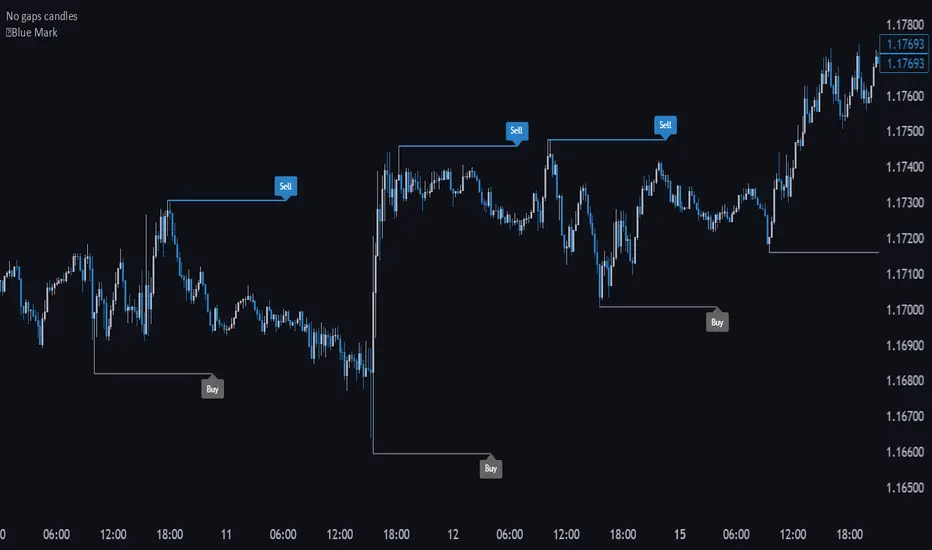
📌 Blue Mark – TradingView Indicator
The Blue Mark indicator highlights extreme price points across multiple timeframes (15m, 5m, 1m), helping intraday traders identify liquidity zones and areas of institutional interest. It is designed for traders who want to spot high-probability entry and exit points based on market structure and volume concentration.
✔️ Marks extreme highs and lows on 15m, 5m, and 1m charts
✔️ Ideal for intraday trading and short-term strategies
✔️ Helps detect liquidity zones where institutional orders are likely concentrated
✔️ Supports tactical entries and exits aligned with market structure
How to use:
Apply the indicator to your chart.
Observe the marked extreme points on different timeframes.
Use these levels to plan entries, exits, or confirm areas of institutional interest.
受保護腳本
此腳本以閉源形式發佈。 不過,您可以自由且不受任何限制地使用它 — 在此處了解更多資訊。
免責聲明
這些資訊和出版物並不意味著也不構成TradingView提供或認可的金融、投資、交易或其他類型的意見或建議。請在使用條款閱讀更多資訊。
受保護腳本
此腳本以閉源形式發佈。 不過,您可以自由且不受任何限制地使用它 — 在此處了解更多資訊。
免責聲明
這些資訊和出版物並不意味著也不構成TradingView提供或認可的金融、投資、交易或其他類型的意見或建議。請在使用條款閱讀更多資訊。