UDAY_C_Santhakumar

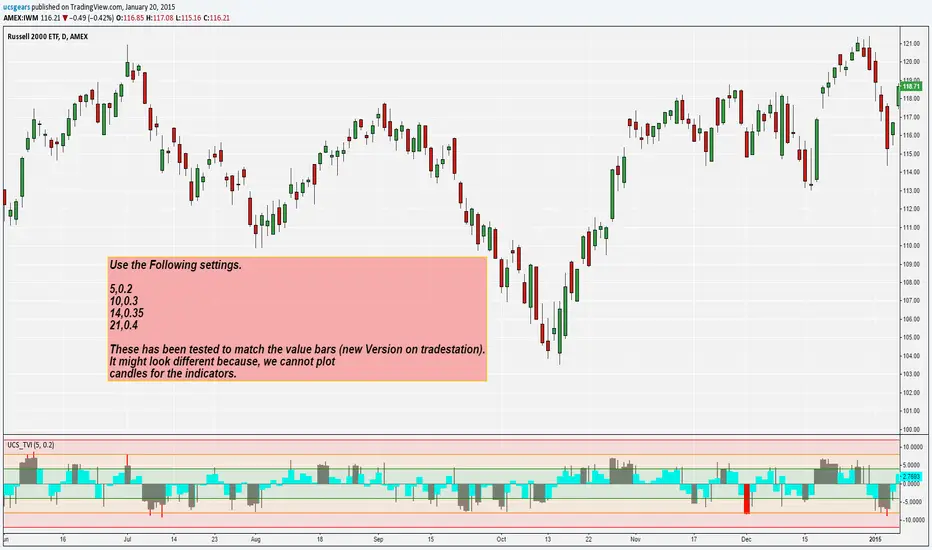
UCS_Transactional Valuation Index-Version 2

Version 1 -
Updates include
Better Optimization on the levels.
Plotting only the important Highs and Lows

The extremes can be an important pivot levels.

Over and Undervalue - Gray (Column - close) (Histogram - High/Low)
Extreme conditions - Red

Extreme Alerts and Overlay will be added later.

Uday C Santhakumar
開源腳本

本著真正的TradingView精神,該腳本的作者將其開源發布,以便交易者可以理解和驗證它。為作者喝彩吧!您可以免費使用它,但在出版物中重複使用此代碼受網站規則的約束。 您可以收藏它以在圖表上使用。

免責聲明

這些資訊和出版物並不意味著也不構成TradingView提供或認可的金融、投資、交易或其他類型的意見或建議。請在使用條款閱讀更多資訊。

想在圖表上使用此腳本?
// Created by UCSgears, Inspired from the Value Bands published recently
// Also Inspired from the Hubert Senters "Death of Fundamentals" Webinar

// Video - https://www.youtube.com/watch?v=LYG2kO_tDtA

study(title="UCS_Transaction Value Index", shorttitle="UCS_TVI", overlay=false)
// INPUT
lbl = input(5, minval=1, title="Look Back Period Length")
sd = input(0.2, minval=0.1, title = "Zone Multiplier")


// Transaction Value Index
tvic = ((close-(sma(close,lbl)))/sma(tr,lbl))/sd
tvih = ((high-(sma(close,lbl)))/sma(tr,lbl))/sd
ptvih = tvih > 4.5 ? tvih:na
tvil = ((low-(sma(close,lbl)))/sma(tr,lbl))/sd
ptvil = tvil < -4.5 ? tvil:na

//
color1= ptvil < -4 and ptvil > -8 ? gray : ptvil < -8 ? red:na
color2= ptvih > 4 and ptvih < 8 ? gray : ptvih > 8 ? red:na

// Horizontal Lines for Zone Seperation
h0=hline(0, "Zero Line", gray, solid, 1)
h1=hline(+4, "Fair Value Top", green, solid, 1)
h2=hline(-4, "Fair Value Bottom", green, solid, 1)
h3=hline(+8, "Over Value", orange, solid, 1)
h4=hline(-8, "Under Value", orange, solid, 1)
h5=hline(+12,"Extremely Over Value", red, solid, 1)
h6=hline(-12,"Extremely Under Value", red, solid, 1)

fill(h1,h2, green, 90, "Fair Value Zone")
fill(h1,h3, orange, 90, "Over Value Zone")
fill(h3,h5, red, 90, "Extremely Over Value Zone")
fill(h2,h4, orange, 90, "Under Value Zone")
fill(h4,h6, red, 90, "Extremely Under Value Zone")
// TVI for High, Low and Close

color3 = (tvic > 4 and tvic < 8) or (tvic < -4 and tvic > -8) ? gray : (tvic > 8 or tvic < -8) ? red : aqua

plot(ptvih, color=color2, title = "TVI - High", style=histogram, linewidth = 2)
plot(ptvil, color=color1, title = "TVI - Low", style=histogram, linewidth = 2)
plot(tvic, color=color3, title = "TVI - Close", style = columns, transp = 0)