OPEN-SOURCE SCRIPT
AZ Column Color
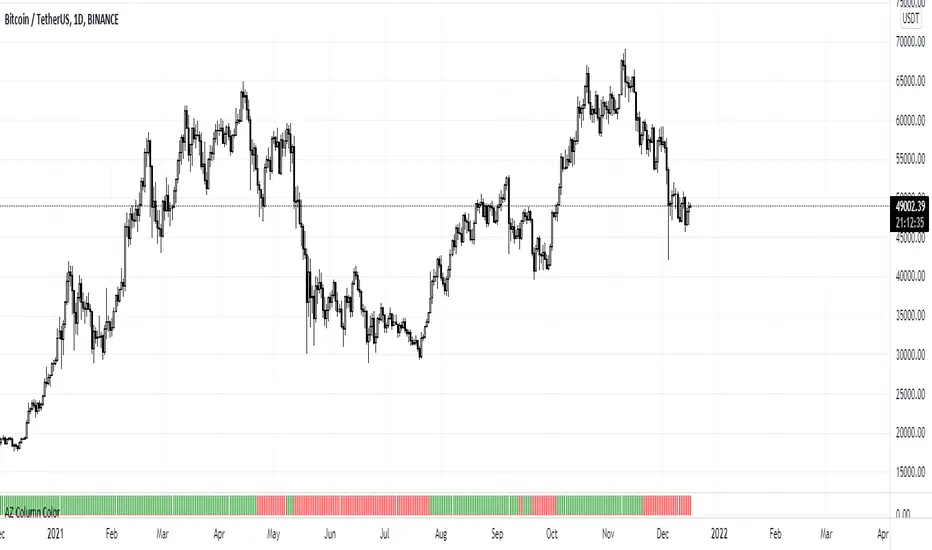
This indicator is based on ema cross-over (12,26).
In Thailand, the ema 12,26 Cross over is well known as the CDC-ACTION ZONE indicator.
.
The definition of a bullish trend in this indicator is when the fast ema crosses up the slow ema .
The definition of a bearish trend is when the fast ema crosses down the slow ema .
.
When fast ema is over slow ema the column will show in a green column and when fast ema is below slow ema the column will show in a red column.
.
I have made this indicator for use with CDC-ACTION ZONE.
開源腳本
秉持TradingView一貫精神,這個腳本的創作者將其設為開源,以便交易者檢視並驗證其功能。向作者致敬!您可以免費使用此腳本,但請注意,重新發佈代碼需遵守我們的社群規範。
免責聲明
這些資訊和出版物並非旨在提供,也不構成TradingView提供或認可的任何形式的財務、投資、交易或其他類型的建議或推薦。請閱讀使用條款以了解更多資訊。
開源腳本
秉持TradingView一貫精神,這個腳本的創作者將其設為開源,以便交易者檢視並驗證其功能。向作者致敬!您可以免費使用此腳本,但請注意,重新發佈代碼需遵守我們的社群規範。
免責聲明
這些資訊和出版物並非旨在提供,也不構成TradingView提供或認可的任何形式的財務、投資、交易或其他類型的建議或推薦。請閱讀使用條款以了解更多資訊。