OPEN-SOURCE SCRIPT
已更新 COVID-19: Daily momentum
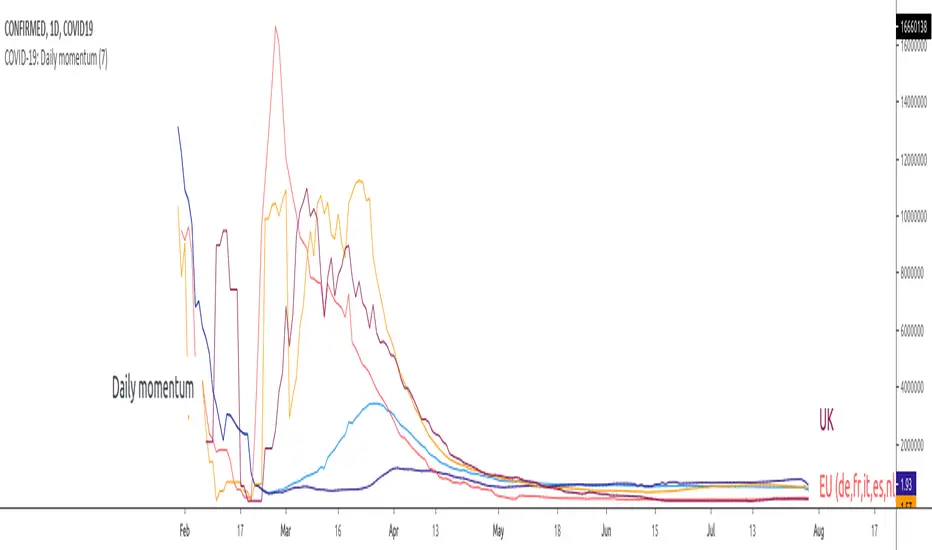
This indicator shows 14-days moving average of daily rate of change (momentum, acceleration), in other words:
- up trends means that virus accelerates at the rate displayed on the right scale
- consolidation/horizontal movement - virus spreads at constant rate
- down trend - virus looses momentum IMPORTANT: the virus STILL accelerates but at a lower rate
By default the graphic displays World vs. EU vs. US vs. Asia while individual countries are available in Settings.
- EU includes the following countries (DE, FR, IT, ES, CH), all with more than 10k confirmed cases and more than 1k new daily infections.
- Asia includes CH and KR
To use the indicator it is important to disconnect main chart from the right scale, on main chart click on More (the 3 dots) -> Pin to scale -> Select "No Scale".
發行說明
# Changelog## 0.0.2 - 2020-04-02
### Added
- Netherlands (NL) - more than 1k new cases / day
- Belgium (BE) - more than 1k new cases / day
- Austria (AT) - more than 10k total cases
### Changed
- rename main function momentum
### Removed
- population texts
發行說明
# Changelog## 0.0.3 - 20200406
### Added
- Portugal, PT - with more than 10k total cases
### Changed
- refactoring and DRY the code
- adjust labels' position
發行說明
Adding Iran, Turkey, India, Indonesia, each of them with over 1k deaths發行說明
Remove COVID19 prefix, fix GB series' name發行說明
Fix GB data source name.開源腳本
本著TradingView的真正精神,此腳本的創建者將其開源,以便交易者可以查看和驗證其功能。向作者致敬!雖然您可以免費使用它,但請記住,重新發佈程式碼必須遵守我們的網站規則。
免責聲明
這些資訊和出版物並不意味著也不構成TradingView提供或認可的金融、投資、交易或其他類型的意見或建議。請在使用條款閱讀更多資訊。
免責聲明
這些資訊和出版物並不意味著也不構成TradingView提供或認可的金融、投資、交易或其他類型的意見或建議。請在使用條款閱讀更多資訊。