PROTECTED SOURCE SCRIPT
Pa Deviation[M]
Hello everyone,
First of all, what is deviation?
It can be said that the price goes down (or goes out) under the past pivot zone and enters the range again after lingering for a while. (I think so)
I think there is a sign of trend reversal as it hunts the stops below (or above) the pivot zone as well. (RektProof also has a strategy for this.)
In this indicator, I determined the deviation limits with the atr of the pivot regions. For example, the deviation area (pivot zone - atr) must be greater than. It should also make a grand entrance into the range.
Let me tell you a little about the settings:
Pivot Length: It is the value entered for determining the pivot regions. For example, if the pivot length is 5, the low must be less than the past 5 lows and the next 5 lows.
Minimum Bar: The value that determines the minimum bar of the deviation area. For example, if the minimum bar is 4, the indicator will show deviation areas consisting of minimum 4 bars.
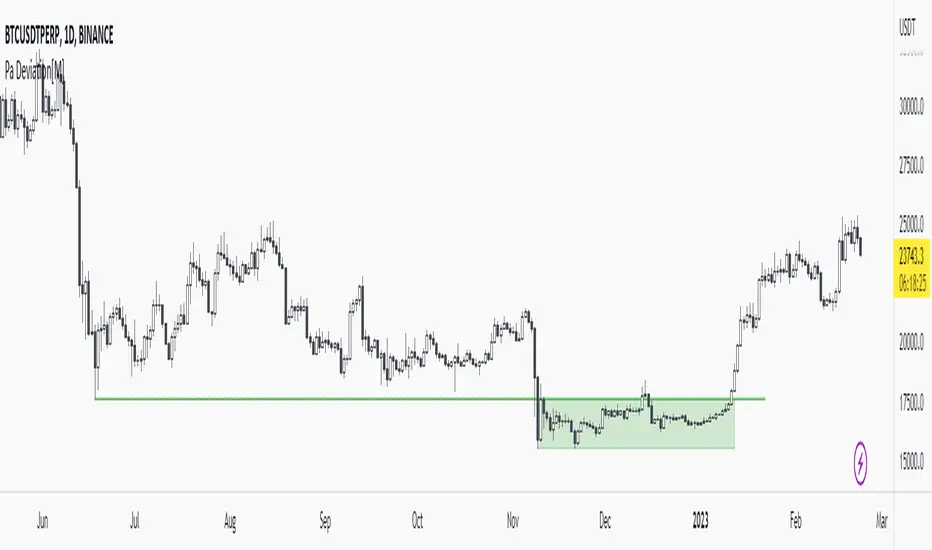
Example Deviation:
1.Pivots and Pivot Lines
As you can see in the image, there are many pivot points. Let's take the lowest pivot point and draw an imaginary line. This is our pivot line

2.Deviation
As you can see, an accumulation has occurred under our pivot line. If the price goes above our pivot line again, it will be a deviation.

3.Return to Range
Voila! Price accumulated below the pivot line and splendidly rose above the pivot line. This is the deviation area for us now.

Other Examples:


First of all, what is deviation?
It can be said that the price goes down (or goes out) under the past pivot zone and enters the range again after lingering for a while. (I think so)
I think there is a sign of trend reversal as it hunts the stops below (or above) the pivot zone as well. (RektProof also has a strategy for this.)
In this indicator, I determined the deviation limits with the atr of the pivot regions. For example, the deviation area (pivot zone - atr) must be greater than. It should also make a grand entrance into the range.
Let me tell you a little about the settings:
Pivot Length: It is the value entered for determining the pivot regions. For example, if the pivot length is 5, the low must be less than the past 5 lows and the next 5 lows.
Minimum Bar: The value that determines the minimum bar of the deviation area. For example, if the minimum bar is 4, the indicator will show deviation areas consisting of minimum 4 bars.
Example Deviation:
1.Pivots and Pivot Lines
As you can see in the image, there are many pivot points. Let's take the lowest pivot point and draw an imaginary line. This is our pivot line
2.Deviation
As you can see, an accumulation has occurred under our pivot line. If the price goes above our pivot line again, it will be a deviation.
3.Return to Range
Voila! Price accumulated below the pivot line and splendidly rose above the pivot line. This is the deviation area for us now.
Other Examples:
受保護腳本
此腳本以閉源形式發佈。 不過,您可以自由使用,沒有任何限制 — 點擊此處了解更多。
Built your TradingView Tools with Pine Script Experts - milvetti.com
免責聲明
這些資訊和出版物並非旨在提供,也不構成TradingView提供或認可的任何形式的財務、投資、交易或其他類型的建議或推薦。請閱讀使用條款以了解更多資訊。
受保護腳本
此腳本以閉源形式發佈。 不過,您可以自由使用,沒有任何限制 — 點擊此處了解更多。
Built your TradingView Tools with Pine Script Experts - milvetti.com
免責聲明
這些資訊和出版物並非旨在提供,也不構成TradingView提供或認可的任何形式的財務、投資、交易或其他類型的建議或推薦。請閱讀使用條款以了解更多資訊。