PROTECTED SOURCE SCRIPT
已更新 MACD X Pivot
The Theory of Entanglement (缠论) is one of the most widely studied trading theories in China, but it is much less known among traders outside. Fractals, strokes, line segments and pivots are basic elements in the Theory of Entanglement. This indicator, MACD X Pivot, applies the concept of strokes, line segment and pivot to the classic MACD indicator and provides a good indication of the exact turning point of a trend based on MACD divergence. Also see a related indicator for applying the Theory of Entanglement on the price chart: tradingview.com/script/5khLVtBp/.
Relations between stroke, line segment and pivot:
• Stroke: Connecting two adjacent top and bottom fractals with at least one candlestick in between.
• Line segment: Consists of an odd number of strokes, at least three strokes are required, and the first three strokes must have overlapping parts.
• Pivot: The part of a trend type at a certain level that is overlapped by at least three consecutive sub-level trend types.
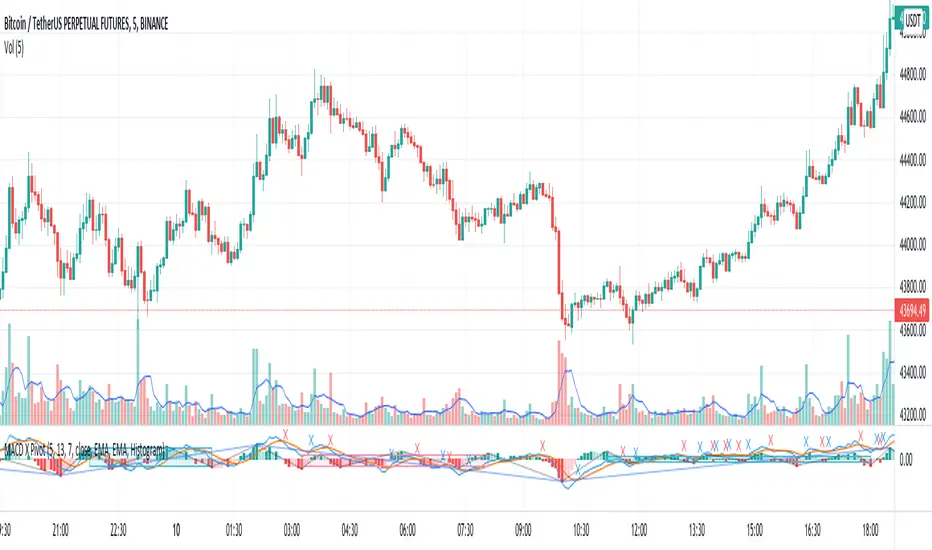
List of drawings on the chart:
1. Blue and red crosses: golden and death crosses between MACD and signal lines.
1. Gray lines: Strokes at the current level.
2. Blue lines: Strokes at a higher level, also line segments at the current level.
3. Blue shaded rectangles: Bullish pivot.
4. Red shaded rectangles: Bearish pivot.
How to use the indicator:
1. The golden cross and death cross between the MACD and signal lines: Blue cross: MACD line crosses up the signal line - buy signal; Red cross: MACD line crosses down the signal line: sell signal.
2. For the bullish blue pivot, the 2nd low (higher low) provides a good indication of the exact turning point from a bearish to bullish trend.
3. For the bearish red pivot, the 2nd high (lower high) provides a good indication of the exact turning point from a bullish to bearish trend.
Relations between stroke, line segment and pivot:
• Stroke: Connecting two adjacent top and bottom fractals with at least one candlestick in between.
• Line segment: Consists of an odd number of strokes, at least three strokes are required, and the first three strokes must have overlapping parts.
• Pivot: The part of a trend type at a certain level that is overlapped by at least three consecutive sub-level trend types.
List of drawings on the chart:
1. Blue and red crosses: golden and death crosses between MACD and signal lines.
1. Gray lines: Strokes at the current level.
2. Blue lines: Strokes at a higher level, also line segments at the current level.
3. Blue shaded rectangles: Bullish pivot.
4. Red shaded rectangles: Bearish pivot.
How to use the indicator:
1. The golden cross and death cross between the MACD and signal lines: Blue cross: MACD line crosses up the signal line - buy signal; Red cross: MACD line crosses down the signal line: sell signal.
2. For the bullish blue pivot, the 2nd low (higher low) provides a good indication of the exact turning point from a bearish to bullish trend.
3. For the bearish red pivot, the 2nd high (lower high) provides a good indication of the exact turning point from a bullish to bearish trend.
發行說明
Modified several input parameters to improve signal reliability.發行說明
Separated input parameter settings for MACD, signal lines and histogram.發行說明
1. Added a new MACD line for identifying higher-level divergence. 2. Adjusted scales of MACD and signal lines and height of histogram for better clarity.發行說明
Minor bug fix.受保護腳本
此腳本以閉源形式發佈。 不過,您可以自由使用,沒有任何限制 — 點擊此處了解更多。
免責聲明
這些資訊和出版物並非旨在提供,也不構成TradingView提供或認可的任何形式的財務、投資、交易或其他類型的建議或推薦。請閱讀使用條款以了解更多資訊。
受保護腳本
此腳本以閉源形式發佈。 不過,您可以自由使用,沒有任何限制 — 點擊此處了解更多。
免責聲明
這些資訊和出版物並非旨在提供,也不構成TradingView提供或認可的任何形式的財務、投資、交易或其他類型的建議或推薦。請閱讀使用條款以了解更多資訊。