OPEN-SOURCE SCRIPT
BarUpDn time limited
trying to understand strategies, it appears that there is a lot of black magic in how a strat works behind the scenes.
anyway, it's hard to analyse what's all the data with one gazillion entries, and i wanted to know how we can manipulate/do stuff with a chart.
so, i needed to know how to "give" the script my values to work on. bundled two wants/needs into one, and created a script that only applies a strategy from the date given onwards.
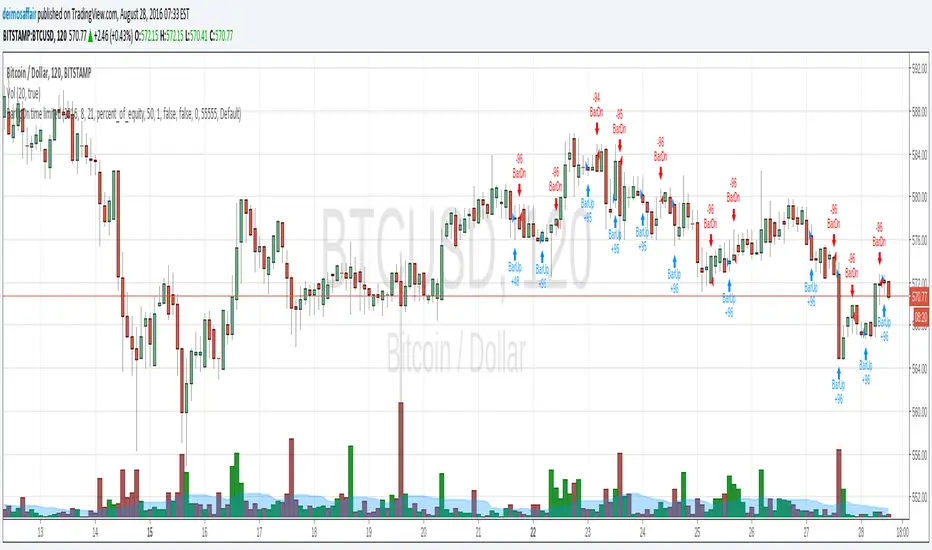
how to use:
at the chart, go to the "format" little button, then the input tab, and there is all the date fields i created. fun to set it to the current date, then start going backwards and see all the little arrows filing up the chart :)
anyway, it's hard to analyse what's all the data with one gazillion entries, and i wanted to know how we can manipulate/do stuff with a chart.
so, i needed to know how to "give" the script my values to work on. bundled two wants/needs into one, and created a script that only applies a strategy from the date given onwards.
how to use:
at the chart, go to the "format" little button, then the input tab, and there is all the date fields i created. fun to set it to the current date, then start going backwards and see all the little arrows filing up the chart :)
開源腳本
秉持TradingView一貫精神,這個腳本的創作者將其設為開源,以便交易者檢視並驗證其功能。向作者致敬!您可以免費使用此腳本,但請注意,重新發佈代碼需遵守我們的社群規範。
免責聲明
這些資訊和出版物並非旨在提供,也不構成TradingView提供或認可的任何形式的財務、投資、交易或其他類型的建議或推薦。請閱讀使用條款以了解更多資訊。
開源腳本
秉持TradingView一貫精神,這個腳本的創作者將其設為開源,以便交易者檢視並驗證其功能。向作者致敬!您可以免費使用此腳本,但請注意,重新發佈代碼需遵守我們的社群規範。
免責聲明
這些資訊和出版物並非旨在提供,也不構成TradingView提供或認可的任何形式的財務、投資、交易或其他類型的建議或推薦。請閱讀使用條款以了解更多資訊。