INVITE-ONLY SCRIPT
已更新 RSI – Signal (Expo)
DESCRIPTION
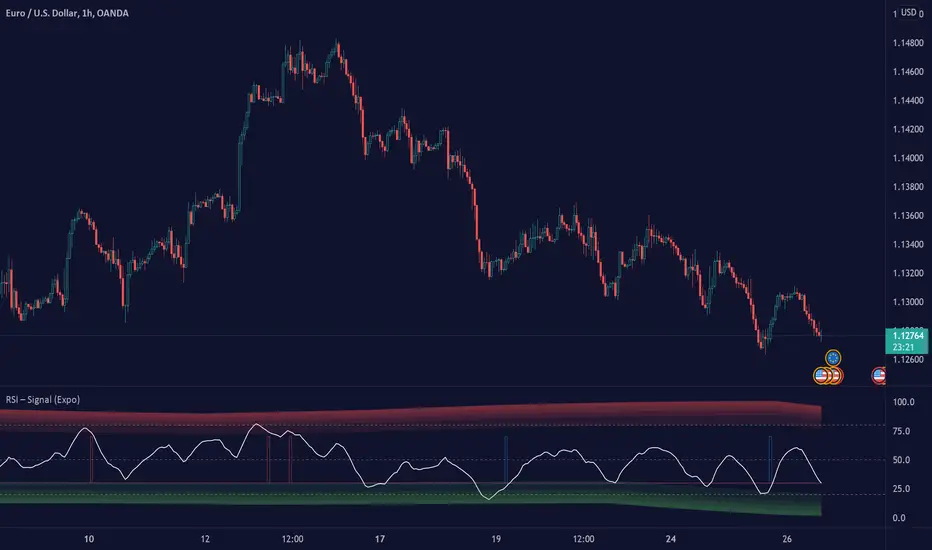
RSI (Relative Strength Index) is a momentum oscillator that measures the speed (velocity) and change (magnitude) of recent price movements.
THIS INDICATOR PLOTS RSI-SIGNALS and makes use of the standard calculation of RSI. The indicator has built-in flexibility that allows you to determine the oversold/overbought value and CrossOver/CrossUnder value of RSI. This enables you to fit the values to the current market characteristics.
HOW TO USE
1. Determine the oversold and overbought value depending on current market characteristics
2. Determine the CrossOver and CrossUnder value depending on current market characteristics
3. When the signal appears, consider Enter the market.
INDICATOR IN ACTION
BTCUSD

ETHUSD

USDJPY

Wall Street

DIVERGENCES:
All types of momentum oscillator indicators produce divergences and so does RSI. Divergences occur when the oscillator deviates from the trending price action. Bullish divergence is then when the trending price makes a lower low but the oscillator makes a higher low. Bearish divergence is then when the trending price makes a higher high but the oscillator makes a lower high.
I hope you find this indicator useful, and please comment or contact me if you like the script or have any questions/suggestions for future improvements. Thanks!
I will continue to work on this indicator, so please share your experience and feedback with me so that I can continuously improve it. Your feedback is valuable for future developments!
-----------------
Disclaimer:
Copyright by Zeiierman.
The information contained in my scripts/indicators/ideas does not constitute financial advice or a solicitation to buy or sell any securities of any type. I will not accept liability for any loss or damage, including without limitation any loss of profit, which may arise directly or indirectly from use of or reliance on such information.
All investments involve risk, and the past performance of a security, industry, sector, market, financial product, trading strategy, or individual’s trading does not guarantee future results or returns. Investors are fully responsible for any investment decisions they make. Such decisions should be based solely on an evaluation of their financial circumstances, investment objectives, risk tolerance, and liquidity needs.
My scripts/indicators/ideas are only for educational purposes!
RSI (Relative Strength Index) is a momentum oscillator that measures the speed (velocity) and change (magnitude) of recent price movements.
THIS INDICATOR PLOTS RSI-SIGNALS and makes use of the standard calculation of RSI. The indicator has built-in flexibility that allows you to determine the oversold/overbought value and CrossOver/CrossUnder value of RSI. This enables you to fit the values to the current market characteristics.
HOW TO USE
1. Determine the oversold and overbought value depending on current market characteristics
2. Determine the CrossOver and CrossUnder value depending on current market characteristics
3. When the signal appears, consider Enter the market.
INDICATOR IN ACTION
BTCUSD
ETHUSD
USDJPY
Wall Street
DIVERGENCES:
All types of momentum oscillator indicators produce divergences and so does RSI. Divergences occur when the oscillator deviates from the trending price action. Bullish divergence is then when the trending price makes a lower low but the oscillator makes a higher low. Bearish divergence is then when the trending price makes a higher high but the oscillator makes a lower high.
I hope you find this indicator useful, and please comment or contact me if you like the script or have any questions/suggestions for future improvements. Thanks!
I will continue to work on this indicator, so please share your experience and feedback with me so that I can continuously improve it. Your feedback is valuable for future developments!
-----------------
Disclaimer:
Copyright by Zeiierman.
The information contained in my scripts/indicators/ideas does not constitute financial advice or a solicitation to buy or sell any securities of any type. I will not accept liability for any loss or damage, including without limitation any loss of profit, which may arise directly or indirectly from use of or reliance on such information.
All investments involve risk, and the past performance of a security, industry, sector, market, financial product, trading strategy, or individual’s trading does not guarantee future results or returns. Investors are fully responsible for any investment decisions they make. Such decisions should be based solely on an evaluation of their financial circumstances, investment objectives, risk tolerance, and liquidity needs.
My scripts/indicators/ideas are only for educational purposes!
發行說明
Major Improvements! - The setting panel is more convenient.
- Trend RSI is added.
- Trend RSI signals are added.
Best
發行說明
Minor Update!Best
發行說明
Improvements! - RSI Signals with Alerts Added!
發行說明
Improvements- Performance improvements
- Enhanced setting panel
- Tooltips added
發行說明
Precision Added發行說明
minor change發行說明
Improvements! - Dynamic and Trend Cloud added
- Performance improvements
發行說明
Improvements!- Minor changes
僅限邀請腳本
只有經作者批准的使用者才能訪問此腳本。您需要申請並獲得使用權限。該權限通常在付款後授予。如欲了解更多詳情,請依照以下作者的說明操作,或直接聯絡Zeiierman。
除非您完全信任其作者並了解腳本的工作原理,否則TradingView不建議您付費或使用腳本。您也可以在我們的社群腳本中找到免費的開源替代方案。
作者的說明
Get instant access here: https://zeiiermantrading.com Leave a thumbs up '👍' to get updated.
Access my indicators at: zeiierman.com/
Join Our Free Discord: discord.gg/zeiiermantrading
Join Our Free Discord: discord.gg/zeiiermantrading
免責聲明
這些資訊和出版物並不意味著也不構成TradingView提供或認可的金融、投資、交易或其他類型的意見或建議。請在使用條款閱讀更多資訊。