INVITE-ONLY SCRIPT
已更新 SMT for Time-Based Sessions [ufo]
SMT for Time-Based Sessions identifies when one asset breaks a session’s high/low while another correlated asset fails to do so. This imbalance often signals engineered liquidity grabs, reversals, or continuation setups. By focusing on divergences within specific trading sessions (London, New York AM, Lunch, New York PM, Asia, Daily or your own custom windows), the tool filters out noise and pinpoints only the most meaningful SMT divergences across multiple symbols in real-time.
Core Concept:
SMT (Smart Money Technique/Tool/Time) is a concept popularized by Inner Circle Trader (ICT) that suggests that when correlated or inversely correlated instruments fail to confirm each other's price movements (e.g., one breaks a high/low while the other doesn’t), it often indicates:
This indicator identifies these divergences by comparing your chart symbol against up to two comparison symbols across different sessions and timeframes.
How Time-Based SMT Works:
Unlike basic divergence tools, this indicator is built specifically for Session-Based and Timeframe-Based SMT tracking. It continuously monitors intraday sessions and higher timeframes, then plots divergences the moment they occur.
Time-Based Session SMT
Consecutive Candle SMT (CC SMT)
How To Use:
This indicator is not a buy/sell signal on its own. Instead, it is designed to highlight Time-Based SMT divergences so you can combine them with your existing trading strategy or model. It should be used as an extra layer of confluence, helping you confirm trade ideas.
Key Features:
Multiple Comparison Symbols
Session-Based SMT Tracking
Consecutive Candle SMT (CC SMT)
Visual Customization
Information Panel
Alert System
How To Setup Alerts:
How This Helps Your Trading:
This tool automates the heavy lifting of tracking divergences across multiple markets and sessions, continuously monitoring highs and lows in real time and plotting only the most meaningful SMT signals so you can focus on execution, not chart-watching.
Core Concept:
SMT (Smart Money Technique/Tool/Time) is a concept popularized by Inner Circle Trader (ICT) that suggests that when correlated or inversely correlated instruments fail to confirm each other's price movements (e.g., one breaks a high/low while the other doesn’t), it often indicates:
- Liquidity manipulation by institutional players
- Potential reversal points in the market
- Weakness or strength in the current trend
- Stop hunt operations before significant moves
This indicator identifies these divergences by comparing your chart symbol against up to two comparison symbols across different sessions and timeframes.
How Time-Based SMT Works:
Unlike basic divergence tools, this indicator is built specifically for Session-Based and Timeframe-Based SMT tracking. It continuously monitors intraday sessions and higher timeframes, then plots divergences the moment they occur.
Time-Based Session SMT
- Session Tracking: Monitors highs and lows during each session
- Post-Session Analysis: After a session ends, tracks whether price breaks session levels
- Divergence Detection: When the main symbol breaks a high/low but comparison symbols don’t (or vice versa), an SMT signal is triggered
(e.g. Nasdaq traded above London high while S&P500 does not) - Visual Confirmation: Lines connect the session reference to the current extreme, with labels showing the diverging session, high/low, and symbol, this information is also displayed in the Info Panel
This will update if a new high/low extreme is made while the SMT is still valid, if invalidated these will be removed from the chart
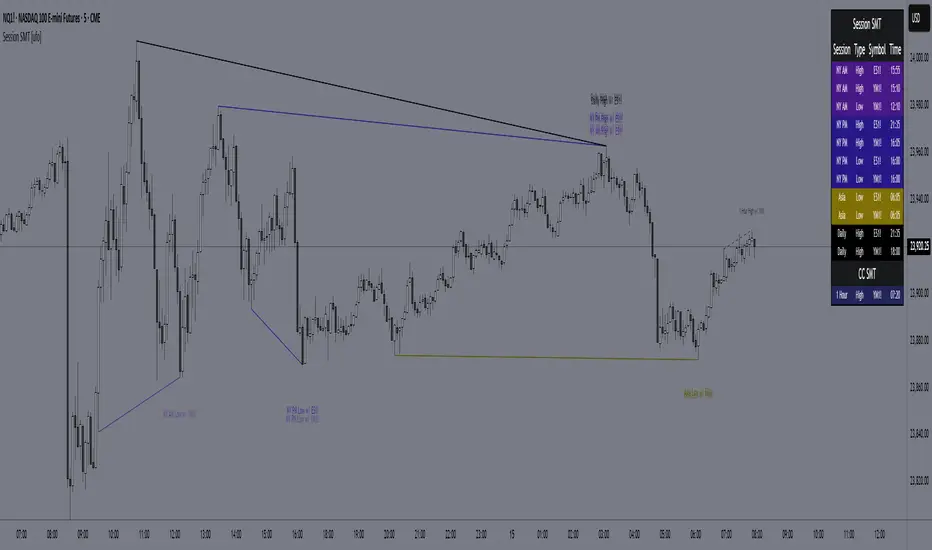
Example:
This NQ chart includes ES and YM as comparison symbols. At 03:20 AM New York time, both ES and YM broke the Asia session low (20:00 – 00:00), while NQ did not. This creates a bullish session divergence, which the indicator immediately detects and plots.Although the chart shows three symbols for illustration, you don’t need to manually monitor comparison charts when using this indicator, the SMT divergence will be plotted automatically as soon as it occurs
Consecutive Candle SMT (CC SMT)
- Previous Candle Reference: Uses the previous candle's high/low from the selected timeframe
- Real-Time Comparison: Monitors if current price breaks these levels across all symbols
- Instant Detection: Triggers SMT immediately when divergence occurs
- Dynamic Updates: Lines and labels update in real-time as new extremes form and are automatically removed if invalidated
Example:
Here I configured CC SMT Timeframe 1 to monitor the previous 4-hour candle’s high/low. On this NQ chart with ES as a comparison symbol, ES broke above the prior 4-hour high at 14:00 New York time, while NQ did not, showing relative weakness creating a bearish CC SMT divergenceThis chart is just an illustration. The indicator will automatically plot SMT divergences on your main chart, regardless of the timeframe you’re viewing
How To Use:
This indicator is not a buy/sell signal on its own. Instead, it is designed to highlight Time-Based SMT divergences so you can combine them with your existing trading strategy or model. It should be used as an extra layer of confluence, helping you confirm trade ideas.
- Select your comparison symbols
For example:
Futures: NQ vs ES/YM
Forex: EURUSD vs GBPUSD/DXY(inversely)
Crypto: BTC vs ETH
Commodities: Gold vs Silver - Choose which sessions or candle timeframes you want the indicator to monitor
- Watch for divergences the indicator plots when one symbol breaks a high/low while the other does not
- Use these divergences as confluence, alongside your own strategy and risk management rules
Key Features:
Multiple Comparison Symbols
- Symbol 1 & Symbol 2: Compare your main chart against up to 2 correlated instruments
- Symbol Inversion: Perfect for inversely correlated pairs (e.g., EURUSD vs DXY)
Session-Based SMT Tracking
- Monitors 7 fully customizable trading sessions with the default being:
London Session (2:00-5:00 NY time)
NY AM Session (9:30-12:00 NY time)
Lunch Session (12:00-13:00 NY time)
NY PM Session (13:00-16:00 NY time)
Asia Session (20:00-00:00 NY time)
Custom Session 6 (if you want to add an extra session)
Daily Session (18:00-18:00 NY time) - Fully customizable session times and names
- Automatically detects when the main symbol breaks a session high/low while comparison symbols don't (and vice versa)
Consecutive Candle SMT (CC SMT)
- Monitors 3 customizable timeframes
- Tracking of divergences based on specific timeframe candles (15min, 60min, 4 hour, weekly, etc.)
- Identifies when the current price breaks the previous candle's high/low differently than comparison symbols
- Maintains history of past SMTs (configurable)
- Timeframe 3 supports custom time shifts for non-standard candle boundaries
Example: 90min timeframe with a +60 shift changes the candle range from:
00:00-01:30, 01:30-03:00 etc
to:
01:00-02:30, 02:30-04:00 etc
Visual Customization
- Line Styles: Customize the line styles for different symbols
- Colors: Unique color schemes for instant session identification
- Adjustable Offsets: Fine-tune label positions with multiplier settings
- Show/Hide Controls: Complete control over visual elements
- Custom Labels: Customize the SMT labels for highs and lows
Information Panel
- Active SMT Conditions: Live tracking of all current divergences
- Session Names: Clear identification of which session created the SMT
- Symbol Information: Shows which comparison symbol is diverging
- Timestamps: Optional time display showing when SMT was first detected
- Flexible Positioning: 8 different panel positions
- Smart Display Modes: Options to hide inactive sessions/timeframes
Alert System
- Configurable alerts for specific sessions or timeframes
- Get notified when new divergences appear instantly
- Clear, informative alert descriptions
How To Setup Alerts:
- Enable the "Enable Alerts" in the settings
- Choose which sessions/timeframes to receive alerts for by choosing it in the setting below
(If you select "All Sessions" you will only be alerted for all the sessions you have enabled in the indicator settings) - Create an alert (ALT+A shortcut) or click the the 3 dots on the indicator "Add alert on Session SMT [ufo]"
- Condition = Session SMT [ufo]
- Function = Any alert() function call
- Alert name (Message) = Anything you prefer (e.g. SMT Alert)
If you want to create another alert for different settings, first input the new settings in the indicator, then create a new alert.
Note: Previous alerts will continue to notify you based on the settings they were originally set for, even if you change the indicator setting.
How This Helps Your Trading:
This tool automates the heavy lifting of tracking divergences across multiple markets and sessions, continuously monitoring highs and lows in real time and plotting only the most meaningful SMT signals so you can focus on execution, not chart-watching.
發行說明
- New: Option to plot labels at the center of SMT lines.
- New: Option to hide older SMT from the chart and Info Panel.
- New: Option to choose alerts for Bullish only, Bearish only, or Both.
- Fixed: Time Shift option for Symbol 2 not working properly.
- New: Alert Delay option:
Waits before triggering an alert. If the SMT condition is still valid when the delay expires and a new candle opens, the alert will fire.
Example: If SMT forms at 09:30:15 with a 1-minute delay, the alert triggers at 09:31:00 (when the next 1-minute candle opens) if the SMT is still valid.
IMPORTANT: Your alert interval setting must be equal to or lower than the delay.
Delay = 15s → set alert interval to at least 15s.
Delay = 1m → set alert interval to at least 1m.
If delay < interval, the alert will only trigger when the next interval candle opens.
You can find the Interval setting in the TradingView alert settings.
發行說明
- Improved: Refined center alignment for position labels.
- Added: Alert Window setting.
This lets you restrict alerts to a specific time range, useful if you only want notifications during defined trading hours.
僅限邀請腳本
僅作者批准的使用者才能訪問此腳本。您需要申請並獲得使用許可,通常需在付款後才能取得。更多詳情,請依照作者以下的指示操作,或直接聯絡Ufonose。
TradingView不建議在未完全信任作者並了解其運作方式的情況下購買或使用腳本。您也可以在我們的社群腳本中找到免費的開源替代方案。
作者的說明
Get access here: https://whop.com/time-based-smt
免責聲明
這些資訊和出版物並非旨在提供,也不構成TradingView提供或認可的任何形式的財務、投資、交易或其他類型的建議或推薦。請閱讀使用條款以了解更多資訊。
僅限邀請腳本
僅作者批准的使用者才能訪問此腳本。您需要申請並獲得使用許可,通常需在付款後才能取得。更多詳情,請依照作者以下的指示操作,或直接聯絡Ufonose。
TradingView不建議在未完全信任作者並了解其運作方式的情況下購買或使用腳本。您也可以在我們的社群腳本中找到免費的開源替代方案。
作者的說明
Get access here: https://whop.com/time-based-smt
免責聲明
這些資訊和出版物並非旨在提供,也不構成TradingView提供或認可的任何形式的財務、投資、交易或其他類型的建議或推薦。請閱讀使用條款以了解更多資訊。