OPEN-SOURCE SCRIPT
Murrey Math Extremes Comparator
HOW IT WORKS
Creates two murrey math oscillators (hidden) one with 256 length another with 32 length and compare each other.
WHAT GIVE ME THIS SCRIPT
The script can give you very valuable information:
- Main Trend
- Pullbacks detections
- Extreme overbought oversold prices alerts
- Divergences
- Any timeframe usage
REFERENCES OF USAGE
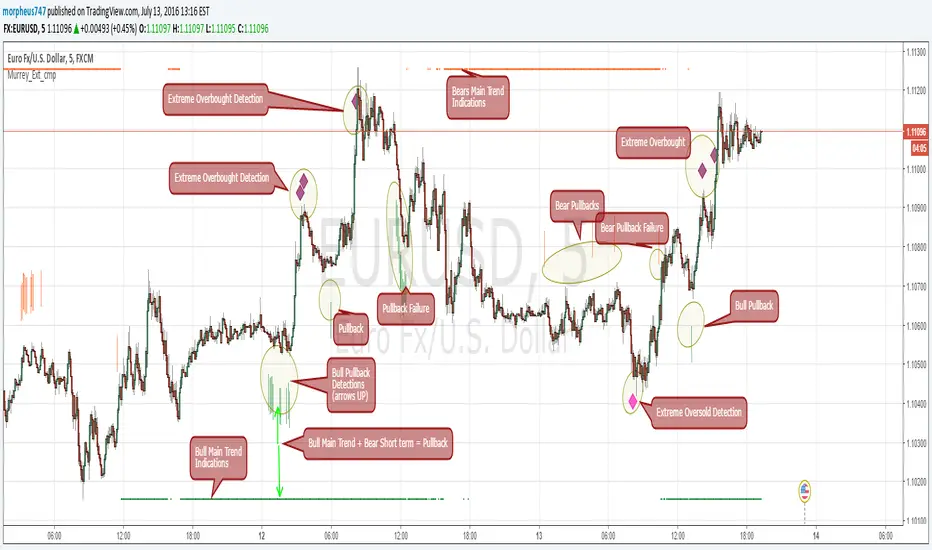
Main Trend Indications
****The main trend is indicated with green(bull) or red(bears) small "triangles" on the bottom(bull) or the top(bears) of the chart.
*****To detect the Bull/Bear major trend the script use 256 murrey, if > 0 (green) we are uptrend in other cases we are downtrend
Pullback detection
****The pullbacks are indicated with Green(bull) or red(bears) medium "Arrows"
*****To detect pullbacks the system compare the long term murrey with the short term murrey, if long term is Green(green triangles)
*****so we are in a main bull trend, if the short term murrey make an extreme low then the pullback is indicated
*****The same for the short pullback, if long term murrey is RED and we have an extreme green short term murrey we shot a red arrow
Extreme Overbught/Oversold
****The extreme OO is indicated with fancy diamonds
*****To detect the Extremes price movements we combine the two murrey, if Long Term Murrey is overbought and short term murrey too
*****Then the diamond show on the screen obove or below based on the extreme if overbought or oversold
Strategy Resume:
Triangles indicate Major Trend Up/Down
Arrows Indicate Continuation pullbacks
Diamonds Indicate Extreme Prices
GUIDE HOW TO IMAGES

How it's works Behind Scene

Creates two murrey math oscillators (hidden) one with 256 length another with 32 length and compare each other.
WHAT GIVE ME THIS SCRIPT
The script can give you very valuable information:
- Main Trend
- Pullbacks detections
- Extreme overbought oversold prices alerts
- Divergences
- Any timeframe usage
REFERENCES OF USAGE
Main Trend Indications
****The main trend is indicated with green(bull) or red(bears) small "triangles" on the bottom(bull) or the top(bears) of the chart.
*****To detect the Bull/Bear major trend the script use 256 murrey, if > 0 (green) we are uptrend in other cases we are downtrend
Pullback detection
****The pullbacks are indicated with Green(bull) or red(bears) medium "Arrows"
*****To detect pullbacks the system compare the long term murrey with the short term murrey, if long term is Green(green triangles)
*****so we are in a main bull trend, if the short term murrey make an extreme low then the pullback is indicated
*****The same for the short pullback, if long term murrey is RED and we have an extreme green short term murrey we shot a red arrow
Extreme Overbught/Oversold
****The extreme OO is indicated with fancy diamonds
*****To detect the Extremes price movements we combine the two murrey, if Long Term Murrey is overbought and short term murrey too
*****Then the diamond show on the screen obove or below based on the extreme if overbought or oversold
Strategy Resume:
Triangles indicate Major Trend Up/Down
Arrows Indicate Continuation pullbacks
Diamonds Indicate Extreme Prices
GUIDE HOW TO IMAGES
How it's works Behind Scene
開源腳本
秉持TradingView一貫精神,這個腳本的創作者將其設為開源,以便交易者檢視並驗證其功能。向作者致敬!您可以免費使用此腳本,但請注意,重新發佈代碼需遵守我們的社群規範。
免責聲明
這些資訊和出版物並非旨在提供,也不構成TradingView提供或認可的任何形式的財務、投資、交易或其他類型的建議或推薦。請閱讀使用條款以了解更多資訊。
開源腳本
秉持TradingView一貫精神,這個腳本的創作者將其設為開源,以便交易者檢視並驗證其功能。向作者致敬!您可以免費使用此腳本,但請注意,重新發佈代碼需遵守我們的社群規範。
免責聲明
這些資訊和出版物並非旨在提供,也不構成TradingView提供或認可的任何形式的財務、投資、交易或其他類型的建議或推薦。請閱讀使用條款以了解更多資訊。