OPEN-SOURCE SCRIPT
Hosoda Waves ABCDE
The Hosoda Waves indicator was devised by Goichi Hosoda, who is also the creator of the Ichimoku system, with the idea that previous highs and lows could determine future price ranges that the market would react to.
Hosoda's projections are the NT, N, V, and E waves, which are derived from calculations based on both upward and downward ABC swings.
Hosoda's waves are derived from the following calculations:
NT Wave = C + (C - A)
N Wave = B + (B - A)
V Wave = B + (B - C)
E Wave = C + (B - A)
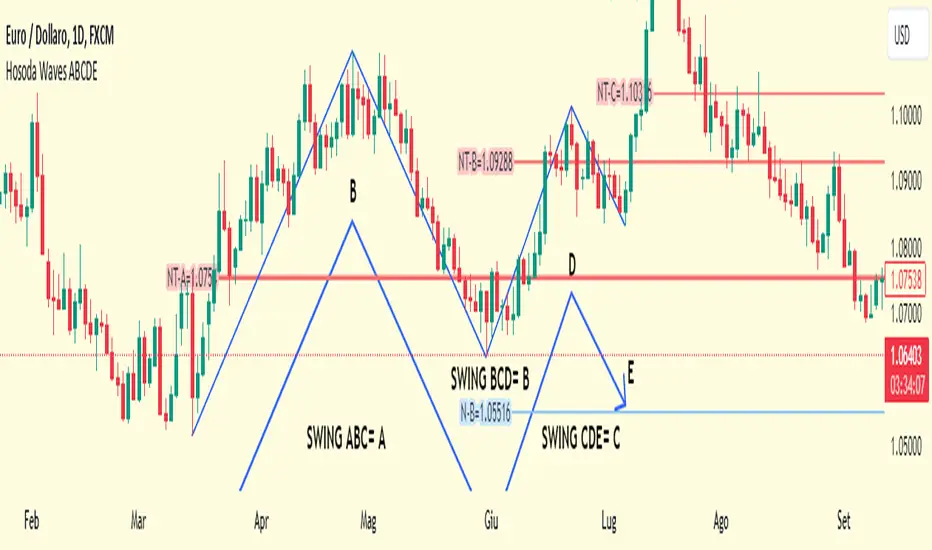
There are already scripts for the Hosoda waves, and my idea is to project an ABCDE swing simultaneously, meaning projecting three swings:
ABC, indicated with an A, resulting in NT-A, N-A, V-A, E-A.
BCD, indicated with a B, resulting in NT-B, N-B, V-B, E-B.
CDE, indicated with a C, resulting in NT-C, N-C, V-C, E-C.
Once the indicator is applied to the chart, the interactive Pine Script tool version 5 will prompt you to identify 5 points of "low-high-low-high-low" or "high-low-high-low-high," both for upward and downward movements and mixed.
Once clicked, these price points can be moved. If you change the time frame or market instrument, the indicator must be removed because it remains tied to the prices where it was initially drawn.
Hosoda's projections are the NT, N, V, and E waves, which are derived from calculations based on both upward and downward ABC swings.
Hosoda's waves are derived from the following calculations:
NT Wave = C + (C - A)
N Wave = B + (B - A)
V Wave = B + (B - C)
E Wave = C + (B - A)
There are already scripts for the Hosoda waves, and my idea is to project an ABCDE swing simultaneously, meaning projecting three swings:
ABC, indicated with an A, resulting in NT-A, N-A, V-A, E-A.
BCD, indicated with a B, resulting in NT-B, N-B, V-B, E-B.
CDE, indicated with a C, resulting in NT-C, N-C, V-C, E-C.
Once the indicator is applied to the chart, the interactive Pine Script tool version 5 will prompt you to identify 5 points of "low-high-low-high-low" or "high-low-high-low-high," both for upward and downward movements and mixed.
Once clicked, these price points can be moved. If you change the time frame or market instrument, the indicator must be removed because it remains tied to the prices where it was initially drawn.
開源腳本
秉持TradingView一貫精神,這個腳本的創作者將其設為開源,以便交易者檢視並驗證其功能。向作者致敬!您可以免費使用此腳本,但請注意,重新發佈代碼需遵守我們的社群規範。
免責聲明
這些資訊和出版物並非旨在提供,也不構成TradingView提供或認可的任何形式的財務、投資、交易或其他類型的建議或推薦。請閱讀使用條款以了解更多資訊。
免責聲明
這些資訊和出版物並非旨在提供,也不構成TradingView提供或認可的任何形式的財務、投資、交易或其他類型的建議或推薦。請閱讀使用條款以了解更多資訊。