OPEN-SOURCE SCRIPT
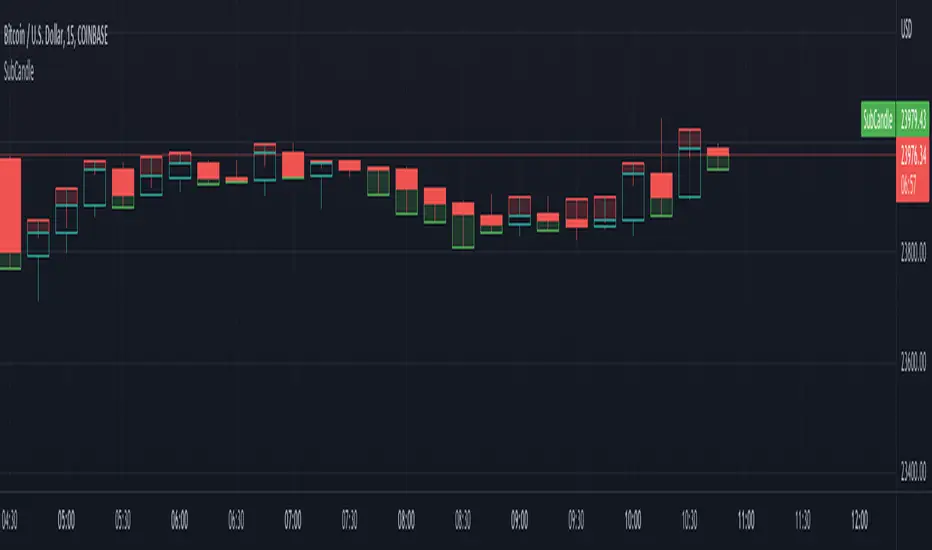
SubCandle
I created this script as POC to handle specific cases where not having tick data on historical bars create repainting. Happy to share if this serves purpose for other coders.
What is the function of this script?
Script plots a sub-candle which is remainder of candle after forming the latest peak.
Here is a screenshot with explanation to visualise the concept:
https://www.tradingview.com/x/dr7ET4Ir/
Settings
There is only one setting which is number of backtest bars. Lower timeframe resolution which is used for calculating the Sub-candle uses this number to automatically calculate maximum possible lower timeframe so that all the required backtest windows are covered without having any issue.
We need to keep in mind that max available lower timeframe bars is 100,000. Hence, with 5000 backtest bars, lower timeframe resolution can be about 20 (100000/5000) times lesser than that of regular chart timeframe. We need to also keep in mind that minimum resolution available as part of security_lower_tf is 1 minute. Hence, it is not advisable to use this script for chart timeframes less than 15 mins.
Application
I have been facing this issue in pattern recognition scripts where patterns are formed using high/low prices but entry and targets are calculated based on the opposite side (low/high). It becomes tricky during extreme bars to identify entry conditions based on just the opposite peak because, the candle might have originated from it before identifying the pattern and might have never reached same peak after forming the pattern. Due to lack of tick data on historical bars, we cannot use close price to measure such conditions. This leads to repaint and few unexpected results. I am intending to use this method to overcome the issue up-to some extent.
What is the function of this script?
Script plots a sub-candle which is remainder of candle after forming the latest peak.
- Higher body of Sub-candle refers to strong retracement of price from its latest peak. Color of the sub-candle defines the direction of retracement.
- Higher wick of Sub-candle refers to higher push in the direction of original candle. Meaning, after price reaching its peak, price retraced but could not hold.
Here is a screenshot with explanation to visualise the concept:
https://www.tradingview.com/x/dr7ET4Ir/
Settings
There is only one setting which is number of backtest bars. Lower timeframe resolution which is used for calculating the Sub-candle uses this number to automatically calculate maximum possible lower timeframe so that all the required backtest windows are covered without having any issue.
We need to keep in mind that max available lower timeframe bars is 100,000. Hence, with 5000 backtest bars, lower timeframe resolution can be about 20 (100000/5000) times lesser than that of regular chart timeframe. We need to also keep in mind that minimum resolution available as part of security_lower_tf is 1 minute. Hence, it is not advisable to use this script for chart timeframes less than 15 mins.
Application
I have been facing this issue in pattern recognition scripts where patterns are formed using high/low prices but entry and targets are calculated based on the opposite side (low/high). It becomes tricky during extreme bars to identify entry conditions based on just the opposite peak because, the candle might have originated from it before identifying the pattern and might have never reached same peak after forming the pattern. Due to lack of tick data on historical bars, we cannot use close price to measure such conditions. This leads to repaint and few unexpected results. I am intending to use this method to overcome the issue up-to some extent.
開源腳本
本著TradingView的真正精神,此腳本的創建者將其開源,以便交易者可以查看和驗證其功能。向作者致敬!雖然您可以免費使用它,但請記住,重新發佈程式碼必須遵守我們的網站規則。
Trial - trendoscope.io/trial
Subscribe - trendoscope.io/pricing
Blog - docs.trendoscope.io
Subscribe - trendoscope.io/pricing
Blog - docs.trendoscope.io
免責聲明
這些資訊和出版物並不意味著也不構成TradingView提供或認可的金融、投資、交易或其他類型的意見或建議。請在使用條款閱讀更多資訊。