INVITE-ONLY SCRIPT
Spot the Peak & Bottom

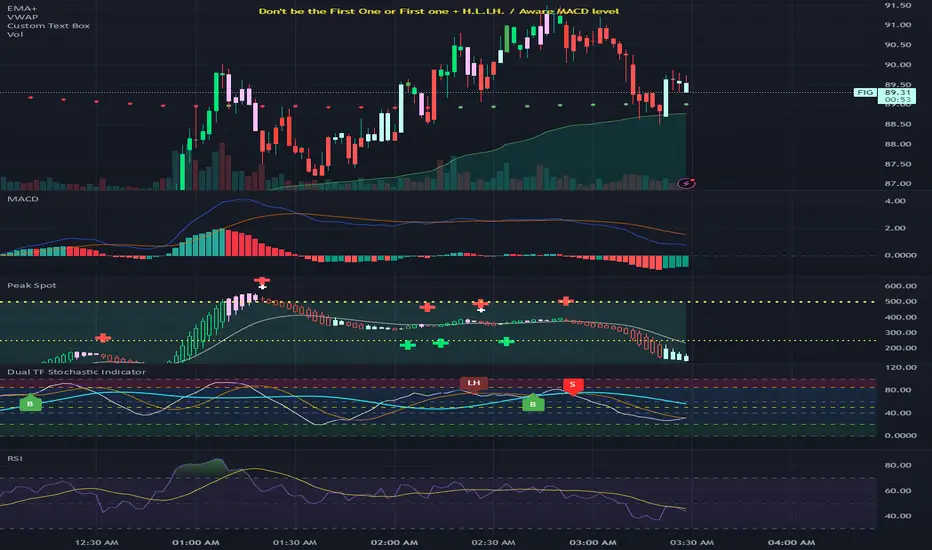
Combines Heikin-Ashi candlesticks with MACD histogram analysis to identify potential market reversals and trend continuations. The script provides advanced pattern recognition with visual signals and alerts.
Core Components
1. Technical Foundation
Heikin-Ashi Candlesticks: Modified candlestick calculation that smooths price action
MACD Histogram: Custom STMC (Smooth Trend Momentum Change) oscillator
Multiple Price Sources: Support for open, high, low, close, and various averages (hl2, hlc3, ohlc4, hlcc4)
2. Pattern Detection System
Bullish Patterns:
HA D ↑ → HA ↑: Divergence resolution (Heikin-Ashi bearish but histogram strengthening, then turning bullish)
Normal Rise: HA rising + histogram strengthening/maintaining
Bottom Reversal: HA falling but histogram strengthening
Bearish Patterns:
HA U ↓ → HA ↓: Divergence resolution (Heikin-Ashi bullish but histogram weakening, then turning bearish)
Top Reversal: HA rising but histogram weakening
Strong Downtrend: HA falling + histogram weakening
Divergence Patterns:
HA D ↓: Heikin-Ashi bullish but momentum weakening
HA D ↑: Heikin-Ashi bearish but momentum strengthening
3. Signal Classification System
Bullish Signals (▲):
Bull Highlight: Higher HA close than previous signal (strongest)
Bull Normal: Normal signal within neutral range (-100 to 100)
Bull Gray: Normal signal outside neutral range
Bearish Signals (▼):
Bear Highlight: Lower HA close than previous signal (strongest)
Bear Normal: Normal signal within neutral range (-100 to 100)
Bear Gray: Normal signal outside neutral range
Transition Signals:
HA DD: Hollow green to hollow red transition
HA UU: Hollow red to hollow green transition
4. Visual Features
Color Coding:
Green/Lime: Bullish patterns and signals
Red/Orange: Bearish patterns and signals
Pink/Cyan: Divergence conditions
White: Neutral signals
Background Zones:
Upper Zone (50-500): Overbought/extreme high areas
Lower Zone (-50 to -500): Oversold/extreme low areas
Reference Lines: Do Not Short (-500), Do Not Long (500), Semi-lines (±250)
Display Modes:
Hybrid: Shows both MACD and Heikin-Ashi
MACD: MACD line and signal only
Histogram: Histogram only
5. Alert System
The script provides comprehensive alerts for:
Bull/Bear signal types (Highlight, Normal, Neutral Area)
HA DD/UU transitions
Divergence start/end conditions
6. Customization Options
MACD Settings: Fast/slow lengths, signal parameters
UI Options: Colors, display modes, background fills
Pattern Detection: Enable/disable various pattern types
Divergence Styling: Custom colors for divergence conditions
This indicator is particularly useful for traders who want to combine the smoothing benefits of Heikin-Ashi with the momentum insights of MACD for more accurate entry and exit timing.
僅限邀請腳本
僅作者批准的使用者才能訪問此腳本。您需要申請並獲得使用許可,通常需在付款後才能取得。更多詳情,請依照作者以下的指示操作,或直接聯絡sickleavetoday。
TradingView不建議在未完全信任作者並了解其運作方式的情況下購買或使用腳本。您也可以在我們的社群腳本中找到免費的開源替代方案。
作者的說明
send me a message
免責聲明
這些資訊和出版物並非旨在提供,也不構成TradingView提供或認可的任何形式的財務、投資、交易或其他類型的建議或推薦。請閱讀使用條款以了解更多資訊。
僅限邀請腳本
僅作者批准的使用者才能訪問此腳本。您需要申請並獲得使用許可,通常需在付款後才能取得。更多詳情,請依照作者以下的指示操作,或直接聯絡sickleavetoday。
TradingView不建議在未完全信任作者並了解其運作方式的情況下購買或使用腳本。您也可以在我們的社群腳本中找到免費的開源替代方案。
作者的說明
send me a message
免責聲明
這些資訊和出版物並非旨在提供,也不構成TradingView提供或認可的任何形式的財務、投資、交易或其他類型的建議或推薦。請閱讀使用條款以了解更多資訊。