PROTECTED SOURCE SCRIPT
已更新 Snake/RSI

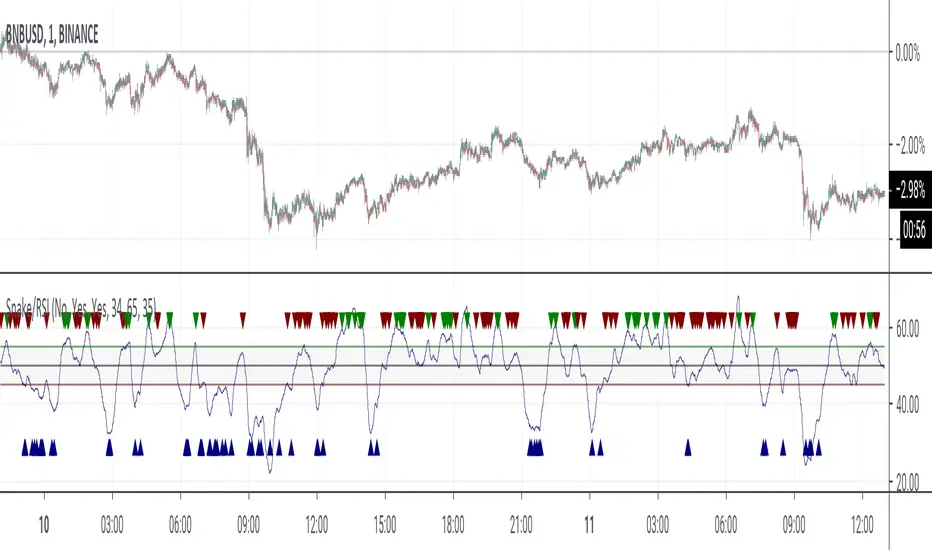
This study is similar to my Snake study. The differernce is that instead of following a moving average, this "snake" follows a RSI closely looking for the best opportunities to buy/sell.
Dark red triangles at the bottom are buy signals with alerts of BUY ASSET. Dark red triangles to the top are sell signals with alerts of SELL ASSET.
Overbought and oversold are configurable as well as the length of the RSI itself.
Dark red triangles at the bottom are buy signals with alerts of BUY ASSET. Dark red triangles to the top are sell signals with alerts of SELL ASSET.
Overbought and oversold are configurable as well as the length of the RSI itself.
發行說明
Make this study more visual and seperated it from the main chart.Refined equations and added "slither" mode
Slither mode allows the snake to buy and sell with a rapid swing algorithm that still produces profit while minimizing the whipsaw effect. Slither is disabled by default.
發行說明
Fixed minor error on crossover analysis.In regular mode, assets are only evaluated at the crossover points.
In Slither mode, assets are only evaluated in the appropiate RSI zone.
Slither operates OPPOSITE to regular mode.
發行說明
Tuned the slither mode to allow an aggressive state vs a smoothed state to filter weak signals.發行說明
Added a sell failed assets (SFA) mode. SFA is only available in slither mode.if SFA is Yes, then assets will be sold when they are between the lower boundry and upper boundry, and retrace towards the lower boundry.
Triangles for sells are now green for selling above the upper boundry and red when the asset retraces between the lower and upper boundries.
IMPORTANT: Not all coins are suitable for SFA.
Coins that have a high probility of crossing the upper boundry should NOT use SFA mode. BNB is an example of a coin that performs badly in SFA mode. SFA on these coins will cause more losses then gains.
Coins like BAT are an example of coins that do well with SFA. BAT has a history of crossing the lower boundry, then retracing before the upper boundry. Typically, BAT also trends lower the the initial purchase price, causing a loss. SFA mode allows the permature sell of coins like BAT at the best opportunity before retracement to a loss allowing break even or a small profit in most cases.
發行說明
Separated aggressive mode from slither mode. Tuned the smoothing effect to be more responsive without over responding to market conditions.
受保護腳本
此腳本以閉源形式發佈。 不過,您可以自由使用,沒有任何限制 — 點擊此處了解更多。
Join my Patreon for exclusive access to Jackrabbit TV,
patreon.com/RD3277
patreon.com/RD3277
免責聲明
這些資訊和出版物並非旨在提供,也不構成TradingView提供或認可的任何形式的財務、投資、交易或其他類型的建議或推薦。請閱讀使用條款以了解更多資訊。
受保護腳本
此腳本以閉源形式發佈。 不過,您可以自由使用,沒有任何限制 — 點擊此處了解更多。
Join my Patreon for exclusive access to Jackrabbit TV,
patreon.com/RD3277
patreon.com/RD3277
免責聲明
這些資訊和出版物並非旨在提供,也不構成TradingView提供或認可的任何形式的財務、投資、交易或其他類型的建議或推薦。請閱讀使用條款以了解更多資訊。