INVITE-ONLY SCRIPT
OBV Bottoms and Tops by Richie Rich
Hello and Welcome to Trading With Richie Rich's Indicator Suite!
This Indicator is known as OBV Bottoms and Tops Finder because it has been consistent with the bottoms and tops to the extreme levels possible with the help of On Balance Volume (OBV) which can be used for scalping as well Investing.
How to Use OBV Bottoms and Tops Finder Indicator?
General Idea - Everyone in trading is familiar with On Balance Volume (OBV) and it is mainly used to calculate Divergences and catch breakouts and breakdowns. But is it possible to catch the bottom or top price of an asset with the help of On Balance Volume? Typically with the normal OBV it is not but with this one.... Yes, it is Now! We'll learn it soon enough.
- After getting access to the indicator you must apply it to your chart and Favorite it so that it becomes handy all the time.
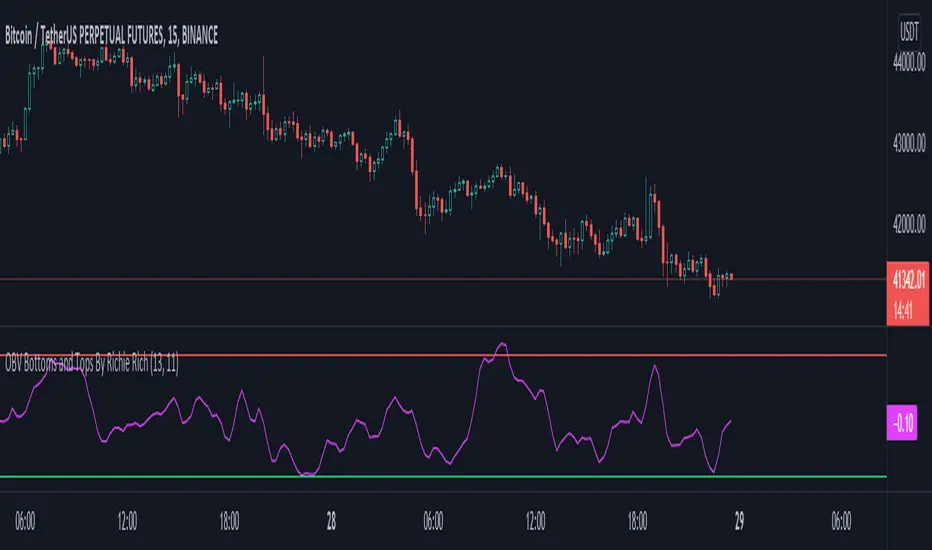
- There are 2 line namely,
1. The Overbought Line (color coded Red) - which helps you to know when the asset has been highly overbought in short term and is due for a correction short term.
2. The Oversold Line (color coded Green) - this helps you know when the price of asset has been really highly oversold and is highly due for a bounce to its main interest
levels.
- Long / Buy Setup - Wait for the main oscillator to fall back below the oversold level ,i.e, -1 and wait for the candle close to always verify it. Once it is in the region of below -1 you should either start to DCA (Dollar Cost Averaging) in a Trade or if you believe the asset is due for a more dump in coming minutes, wait for the indicator to bottom out in the -1.2 to -1.5 region, which will be your ultimate bottom to long. Once you have entered the trade which will basically (might be) the bottom for short term - mid term you should then start focusing on your Risk Reward Ratio. For Scalpers, in my opinion it is enough to target 1-2% on each trade and then flip and rotate.
If you are with a large sized portfolio and are basically an investor rather than a Trader. You should switch the chart to 4hour chart and apply the indicator and just basically wait for the Trade God and the Extreme Top and Bottom Finder to completely bottom out. Once they both are at there lowest you might have entered the Bottom once again at start focusing on your Risk Reward Ratio. After Bottoming out on a 4hour chart, i have backtested to find out that the asset price usually rises to 10-20% a minimum that will be your Take Profits Zone!
- Short / Sell Setup - Wait for the main oscillator to rise above below the overbought level ,i.e, +1 and wait for the candle close to always verify it. Once it is in the region of above +1 you should either start to DCA (Dollar Cost Averaging) in a Trade or if you believe the asset is due for a more pump in coming minutes, wait for the indicator to Top out in the +1.2 to +1.5 region, which will be your ultimate Top to short. Once you have entered the trade which will basically (might be) the Top for short term - mid term should then start focusing on your Risk Reward Ratio. For Scalpers, in my opinion it is enough to target 1-2% on each trade and then flip and rotate.
If you are with a large sized portfolio switch to low leverage mode and switch the chart to 4hour chart and apply the indicator and just basically wait for the Trade God and the Extreme Top and Bottom Finder to completely Top out or show Bearish Divergence after topping out once. Once they both are at there highest or have started to show bearish divergences you might have entered the Top once again at start focusing on your Risk Reward Ratio. After Topping out on a 4hour chart, i have backtested to find out that the asset price usually fall up to 10-20% a minimum that will be your Take Profits Zone!
This really comes in handy when paired with my Trade God/Scalp God and the Extreme Top and Bottom Finder indicator Setup!
All the above examples are backtested and can be checked via applying the indicator on the chart!
This Indicator is known as OBV Bottoms and Tops Finder because it has been consistent with the bottoms and tops to the extreme levels possible with the help of On Balance Volume (OBV) which can be used for scalping as well Investing.
How to Use OBV Bottoms and Tops Finder Indicator?
General Idea - Everyone in trading is familiar with On Balance Volume (OBV) and it is mainly used to calculate Divergences and catch breakouts and breakdowns. But is it possible to catch the bottom or top price of an asset with the help of On Balance Volume? Typically with the normal OBV it is not but with this one.... Yes, it is Now! We'll learn it soon enough.
- After getting access to the indicator you must apply it to your chart and Favorite it so that it becomes handy all the time.
- There are 2 line namely,
1. The Overbought Line (color coded Red) - which helps you to know when the asset has been highly overbought in short term and is due for a correction short term.
2. The Oversold Line (color coded Green) - this helps you know when the price of asset has been really highly oversold and is highly due for a bounce to its main interest
levels.
- Long / Buy Setup - Wait for the main oscillator to fall back below the oversold level ,i.e, -1 and wait for the candle close to always verify it. Once it is in the region of below -1 you should either start to DCA (Dollar Cost Averaging) in a Trade or if you believe the asset is due for a more dump in coming minutes, wait for the indicator to bottom out in the -1.2 to -1.5 region, which will be your ultimate bottom to long. Once you have entered the trade which will basically (might be) the bottom for short term - mid term you should then start focusing on your Risk Reward Ratio. For Scalpers, in my opinion it is enough to target 1-2% on each trade and then flip and rotate.
If you are with a large sized portfolio and are basically an investor rather than a Trader. You should switch the chart to 4hour chart and apply the indicator and just basically wait for the Trade God and the Extreme Top and Bottom Finder to completely bottom out. Once they both are at there lowest you might have entered the Bottom once again at start focusing on your Risk Reward Ratio. After Bottoming out on a 4hour chart, i have backtested to find out that the asset price usually rises to 10-20% a minimum that will be your Take Profits Zone!
- Short / Sell Setup - Wait for the main oscillator to rise above below the overbought level ,i.e, +1 and wait for the candle close to always verify it. Once it is in the region of above +1 you should either start to DCA (Dollar Cost Averaging) in a Trade or if you believe the asset is due for a more pump in coming minutes, wait for the indicator to Top out in the +1.2 to +1.5 region, which will be your ultimate Top to short. Once you have entered the trade which will basically (might be) the Top for short term - mid term should then start focusing on your Risk Reward Ratio. For Scalpers, in my opinion it is enough to target 1-2% on each trade and then flip and rotate.
If you are with a large sized portfolio switch to low leverage mode and switch the chart to 4hour chart and apply the indicator and just basically wait for the Trade God and the Extreme Top and Bottom Finder to completely Top out or show Bearish Divergence after topping out once. Once they both are at there highest or have started to show bearish divergences you might have entered the Top once again at start focusing on your Risk Reward Ratio. After Topping out on a 4hour chart, i have backtested to find out that the asset price usually fall up to 10-20% a minimum that will be your Take Profits Zone!
This really comes in handy when paired with my Trade God/Scalp God and the Extreme Top and Bottom Finder indicator Setup!
All the above examples are backtested and can be checked via applying the indicator on the chart!
僅限邀請腳本
僅作者批准的使用者才能訪問此腳本。您需要申請並獲得使用許可,通常需在付款後才能取得。更多詳情,請依照作者以下的指示操作,或直接聯絡RichieRich_CK。
TradingView不建議在未完全信任作者並了解其運作方式的情況下購買或使用腳本。您也可以在我們的社群腳本中找到免費的開源替代方案。
作者的說明
Kindly DM me on Telegram - t.me/RichieRichCK or @RichieRichCK or Mail me at TradingWithRichieRich@gmail.com to gain access to this Script! Cheers and Thanks! :D
免責聲明
這些資訊和出版物並非旨在提供,也不構成TradingView提供或認可的任何形式的財務、投資、交易或其他類型的建議或推薦。請閱讀使用條款以了解更多資訊。