PROTECTED SOURCE SCRIPT
已更新 Asset Overlay with Lag [CubeT]
Asset Overlay with Lag [CubeT🧊]
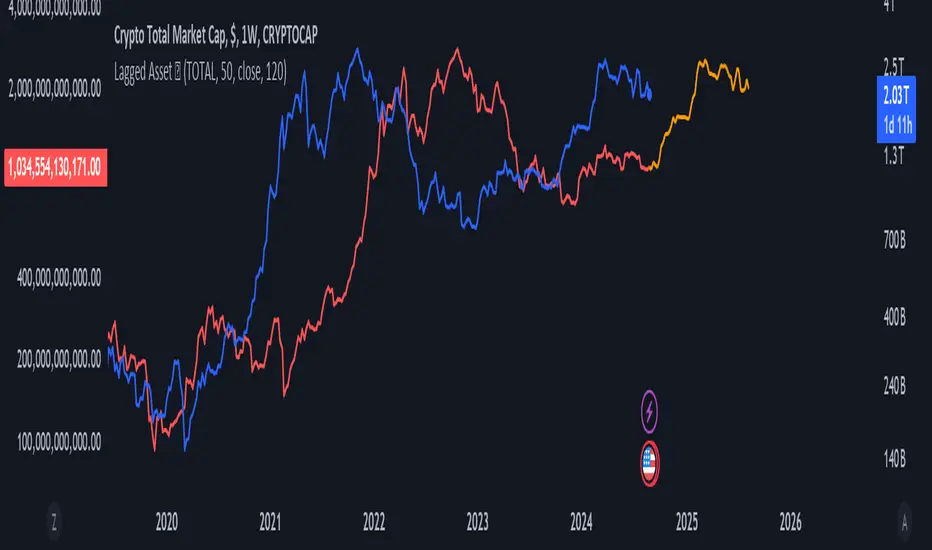
This indicator allows you to overlay a secondary asset on your main chart with a customizable lag. It's perfect for traders who want to analyze the relationship between the current asset and another asset with a time-shifted perspective. The secondary asset’s price data can be lagged by any number of bars, helping you spot leading or lagging behaviors between assets.
Features:
Overlay a secondary asset on your current chart.
Adjust the lag of the secondary asset to visually compare time-shifted movements.
Easily customize the lag amount directly within the settings.
How to Use:
- Add the Indicator: Apply the indicator to your chart in TradingView.
- Select the Secondary Asset: Choose the asset you wish to overlay (e.g., "BTC") from the indicator settings.
- Set the Lag: Adjust the lag amount in bars (e.g., 7 bars for a 1-week lag on a daily chart).
- Adjust Price Scale (Right-click on plotted secondary asset line > Select "Pin to scale" and choose "Pin to new left scale" to separate the scales for clearer comparison.
發行說明
Update:- Added Correlation Coefficient to the script, which can be toggled on for advanced research in settings.
發行說明
- Added "Lagged" asset continuation line in Orange.
發行說明
Added Continuation line style settings發行說明
Continuum Mode UpgradeInstructions for use:
- Continuum Lines: This setting controls the total number of asset overlays.
- Offset: determines how many bars apart each overlay is.
For best results, use an odd number so that the base asset (with your specified lag) is centered in between the additional continuum lines.
Examples:
- Lag: 76, Continuum Lines: 3, Offset: 6 → Overlays at lags 70, 76 (base), 82.
- Lag: 76, Continuum Lines: 7, Offset: 1 → Overlays at lags 73, 74, 75, 76 (base), 77, 78, 79.
Tip: Use more continuum lines with a lower offset, or fewer lines with a higher offset, for optimal display.
發行說明
Continuum Mode Elaboration:Once enabled, you may choose to play around with the number of "Continuum Lines" that form a band around the base lag (main lag selected). Additionally, you can select the "Offset (in Bars)" amount to indicate the lag difference between each line on the continuum.
Very Important to Calculations: all projected lines must be up to 500 days (including the lag & offset) in order to be displayed accurately. If you go over the 500 days limit, some lines may disappear (i.e. start getting replaced by other lines being rendered).
Main Updates & Changes:
- Added color fills in between the past / current lagged price plots. (Unfortunately adding color fills for the projection prices is not supported by Pinescript)
- Dynamic decreasing opacity enabled. (Continuum mode)
- Increased the number of allowed continuum lines to 21.
- Added projection line width parameter.
- Additional styling settings: Line colors > Main settings tab; Line enable, width and other styling options (exc. coloring) > Style settings tab.
受保護腳本
此腳本以閉源形式發佈。 不過,您可以自由使用,沒有任何限制 — 點擊此處了解更多。
免責聲明
這些資訊和出版物並非旨在提供,也不構成TradingView提供或認可的任何形式的財務、投資、交易或其他類型的建議或推薦。請閱讀使用條款以了解更多資訊。
免責聲明
這些資訊和出版物並非旨在提供,也不構成TradingView提供或認可的任何形式的財務、投資、交易或其他類型的建議或推薦。請閱讀使用條款以了解更多資訊。