PROTECTED SOURCE SCRIPT
Adaptive Average True Range
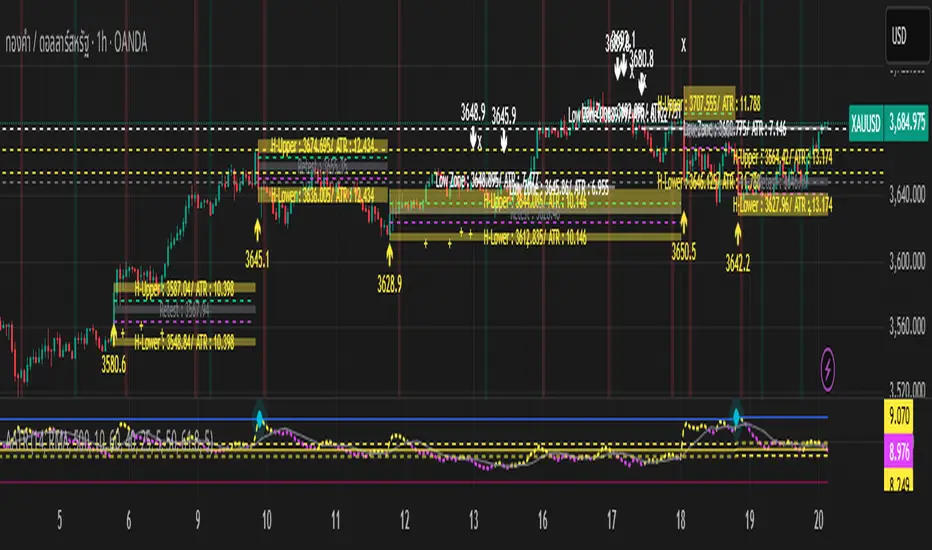
The retest of the candlestick can be categorized into two patterns: a strong trend or a sideways market.
In the case of a strong trend, whether it is a downtrend or an uptrend, the retest often only reaches the box drawn on the wicks. However, sometimes it may only retest the 0.382 level for a downtrend or the 0.732 level for an uptrend. Infrequently, if the asset has sufficient volatility, the price may retest the box on the opposite side of the trend.
In the case of a market entering a sideways phase, whether it's a sideways down or sideways up, the price will typically retest the central box before determining its next direction.
This indicator also measures the standard deviation of the ATR to determine the maximum and minimum price movement, based on another hypothesis regarding "time for a move or time for a slow down," which is plotted as a background color.
Please use this indicator with caution, as it is based solely on a hypothesis.
受保護腳本
此腳本以閉源形式發佈。 不過,您可以自由使用,沒有任何限制 — 點擊此處了解更多。
免責聲明
這些資訊和出版物並非旨在提供,也不構成TradingView提供或認可的任何形式的財務、投資、交易或其他類型的建議或推薦。請閱讀使用條款以了解更多資訊。
受保護腳本
此腳本以閉源形式發佈。 不過,您可以自由使用,沒有任何限制 — 點擊此處了解更多。
免責聲明
這些資訊和出版物並非旨在提供,也不構成TradingView提供或認可的任何形式的財務、投資、交易或其他類型的建議或推薦。請閱讀使用條款以了解更多資訊。