OPEN-SOURCE SCRIPT
Crypto Trend
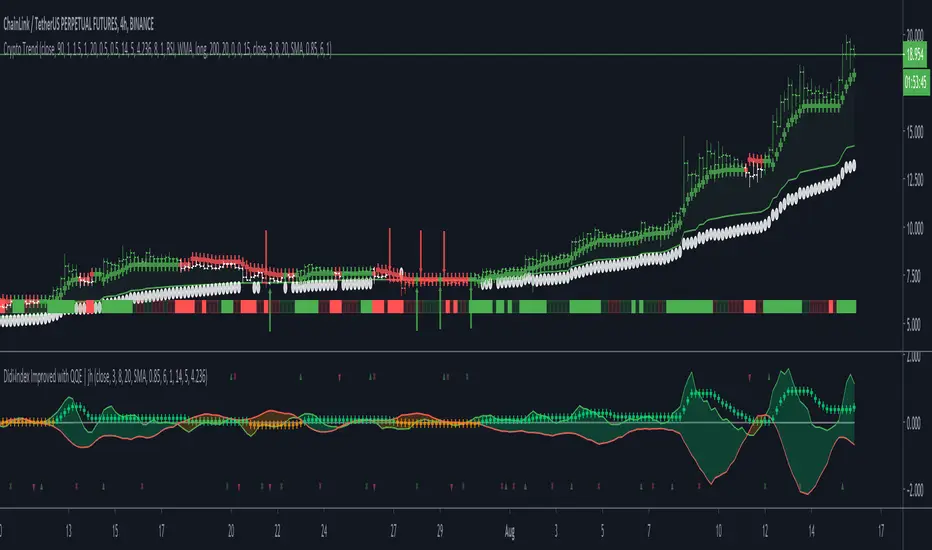
This indicator is based off of the Trend Follower system put together by jiehonglim:

This is a trend following system that combines 3 indicators which provide different functionalities, also a concept conceived by VP's No Nonsense FX / NNFX method. I’m primarily modifying this system for Crypto trading (mostly leveraged Crypto Futures). Suggestions/requests welcome.
New Features:
Added position inputs that will generate position labels
For leverage trading, position inputs will calculate your percentage-based stop loss given your entry, leverage and liquidation price
Added optional horizontal line plots for entry, stop loss, 50% take profit and 100% profit levels.
Added non-plotted Didi calculations for alert condition triggers
Added long and short alerts
These alerts will trigger for any of the 3 following conditions:
Baseline cross with volume confirmation
Didi two line cross with volume confirmation
Didi continuation with volume confirmation
1. Baseline
The main baseline filter is an indicator called Modular Filter created by Alex Grover
- tradingview.com/u/alexgrover/
- Alex Grover - Modular Filter
-------
That's the moving average like baseline following price, filtering long and short trends and providing entry signals when the price crosses the baseline.
Entry signal indicated with arrows.
2. Volume / Volatility , I will called it Trend Strength
The next indicator is commonly known as ASH, Absolute Strength Histogram.
This indicator was shared by VP as a two line cross trend confirmation indicator, however I discovered an interesting property when I modified the calculation of the histogram.
- Alex Grover Absolute Strength
-------
My modification and other info here
- Absolute Strength Histogram v2
-------
I simplified the display of the trend strength by plotting squares at the bottom of the chart.
- Lighted Squares shows strength
- Dimmed Squares shows weakness
3. Second Confirmation / Exits / Trailing Stop
Finally the last indicator is my usage of QQE (Qualitative Quantitative Estimation), demonstrated in my QQE Trailing Line Indicator
- QQE Trailing Line for Trailing Stop
-------
Three usages of this amazing indicator, serving as :
- Second trend confirmation
- Exit signal when price crosses the trailing line
- Trailing stop when you scaled out the second trade
This indicator is plotted with crosses.
4. Position Calculator
For non-leveraged trades, set leverage to 1 and liquidation to 0
Fill out the rest of the position field to get labels that will tell you:
Your stop loss given your acceptable percentage of loss for your risk. So, for example if your actual investment is $200 and you’re trading on 20X leverage, you’d like to know what price would have to drop to for you to lose 15% of your $200 risk. This is what the position calculator is doing for you.
Your 50% take profit point
Your 100% take profit point
Check the “Show Position Lines” to plot horizontal lines for entry, stop loss, 50% TP and 100%TP
Alerts
You just get a Long Alert or Short Alert option. This was for two reasons, the first and most important was to reduce the number of alerts needed for this system to get maximum coverage. The second was just to keep things simple. Get an alert for your desired direction for any interesting signal and then check the chart manually to determine if a viable entry has presented itself. The three alert conditions are:
Main trend indicator, baseline cross with volume confirmation
Didi two line cross entry with volume confirmation
Didi continuation signal with volume confirmation
Additional plots and information
Bar Color
- Green for longs, Red for shorts, White when the baseline direction conflicts with the QQE trailing line direction
- When it's white, it's usually ranging and not trending, ASH will also keep you off ranging periods.
-------
ATR Filter
- White circles along the baseline, they will show up if the price has moved more than one ATR from the baseline
- The default allowance is 1 ATR.
-------
The previous and current ATR value
- Label on the right side of the chart showing the previous and current value of ATR
開源腳本
本著TradingView的真正精神,此腳本的創建者將其開源,以便交易者可以查看和驗證其功能。向作者致敬!雖然您可以免費使用它,但請記住,重新發佈程式碼必須遵守我們的網站規則。
免責聲明
這些資訊和出版物並不意味著也不構成TradingView提供或認可的金融、投資、交易或其他類型的意見或建議。請在使用條款閱讀更多資訊。
開源腳本
本著TradingView的真正精神,此腳本的創建者將其開源,以便交易者可以查看和驗證其功能。向作者致敬!雖然您可以免費使用它,但請記住,重新發佈程式碼必須遵守我們的網站規則。
免責聲明
這些資訊和出版物並不意味著也不構成TradingView提供或認可的金融、投資、交易或其他類型的意見或建議。請在使用條款閱讀更多資訊。