PROTECTED SOURCE SCRIPT
Entropy Percentile
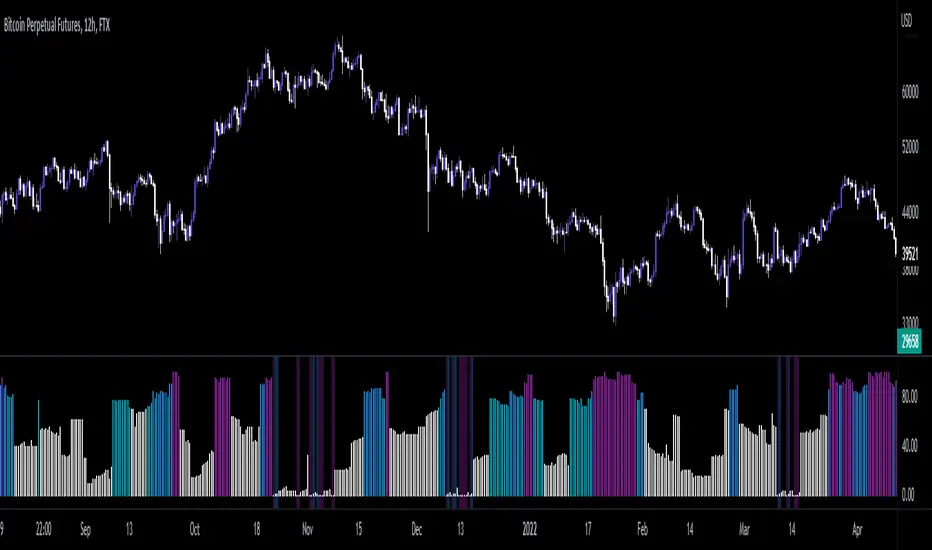
Entropy, in information theory, is the amount of info, or "uncertainty" in the possible outcomes of a variable. For example. when you flip a coin, there are two possible outcomes. That means there is one bit of entropy, as there is a chance it could land on either side, so in other words, there is "one bit of uncertainty". In trading, this can be used to help filter out when there is more or less uncertainty in the possible outcomes of the market.
This indicator takes a shannon entropy formula and applies a percent rank to get an idea of how much of past entropy was equal or lower than the current value, allowing us to see if entropy is at a significant extreme, thus giving us a method of viewing uncertainty in the log returns time series.
Put simply, this allows us to find optimal entries by showing us via background color signals when entropy is at a statistical low, showing where we may find higher probability entries.
受保護腳本
此腳本以閉源形式發佈。 不過,您可以自由使用,沒有任何限制 — 點擊此處了解更多。
免責聲明
這些資訊和出版物並非旨在提供,也不構成TradingView提供或認可的任何形式的財務、投資、交易或其他類型的建議或推薦。請閱讀使用條款以了解更多資訊。
受保護腳本
此腳本以閉源形式發佈。 不過,您可以自由使用,沒有任何限制 — 點擊此處了解更多。
免責聲明
這些資訊和出版物並非旨在提供,也不構成TradingView提供或認可的任何形式的財務、投資、交易或其他類型的建議或推薦。請閱讀使用條款以了解更多資訊。